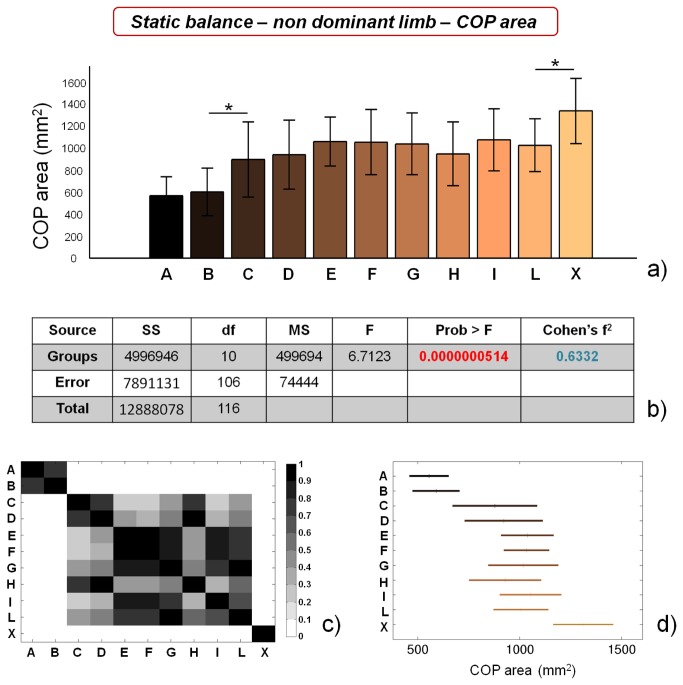
Figure 6. Results of static balance tests, evaluated by means of COP area values, on non dominant limb.
a) COP area values for the different analyzed groups (average value ± standard deviation), from A to X. *=p<0.05; b) results of the analysis of variance (ANOVA) and effect size (Cohen’s f2) calculation; c) matrix reporting the p values for the coupled t-tests between the different groups; d) multiple comparison plot (average values ± 95% of CI, with Bonferroni adjustement).

