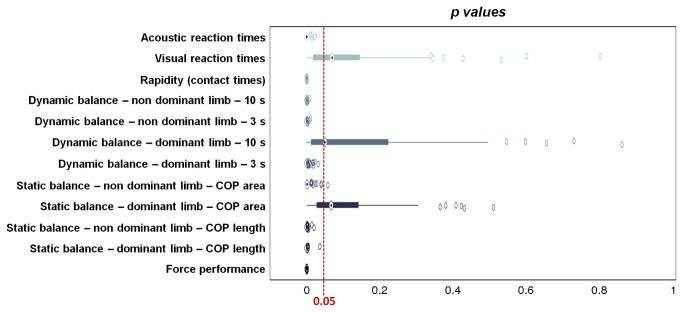
Figure 12. p values distributions for the different tests performed.
100 different p values were calculated for each test, by means of non-parametric ANOVAs, associated with a repeated random sub-sampling-based resampling method. Significance threshold was set at 0.05. Central boxes represent the central 50% of the data; their lower and upper boundary lines are the 25% / 75% quantile of the data. The two “whiskers” extend from the central box maximally to 1.5 times the length of the box. Points that remained out of this range (evidenced with empty circles) were considered as outliers.

