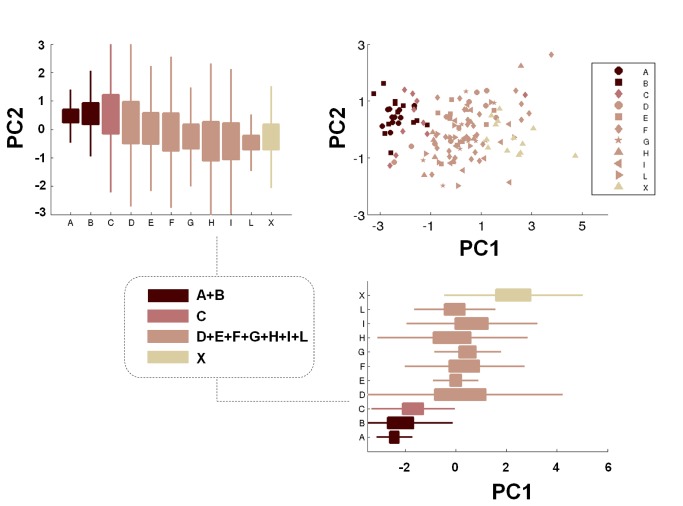
Figure 14. PCA analysis results.
Scatter plot of the athletes playing in all the 10 analyzed categories and of control subjects on the principal component parameters plane and identification of four macro-groups for subjects’ clustering. PC1 and PC2 values for the different categories are also reported, by means of box-plots. Central boxes represent the central 50% of the data; their lower and upper boundary lines are the 25% / 75% quantile of the data. The two “whiskers” extend from the central box maximally to 1.5 times the length of the box. Points that remained out of this range were considered as outliers.

