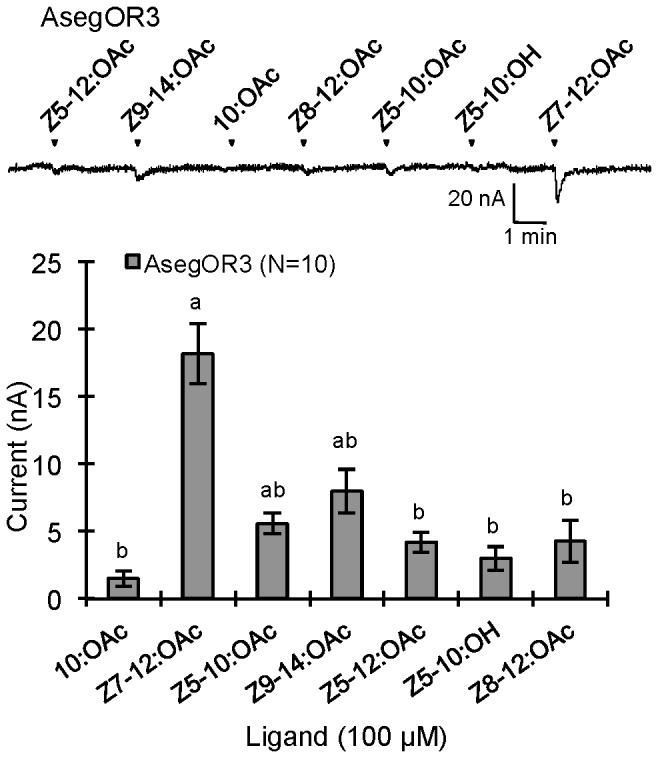
Figure 4. Response profiles and dose responses of AsegOR3.

The upper part indicates current trace of injected oocyte upon successive exposures to 100 μM stimuli. Each chemical was applied at the time point indicated by arrowheads for 20 s. The lower indicates mean values ± SE of the stimulated currents in nA, one-way-ANOVA followed a LSD test, p <0.05. Number of replicates for each receptor is indicated in the legend.
