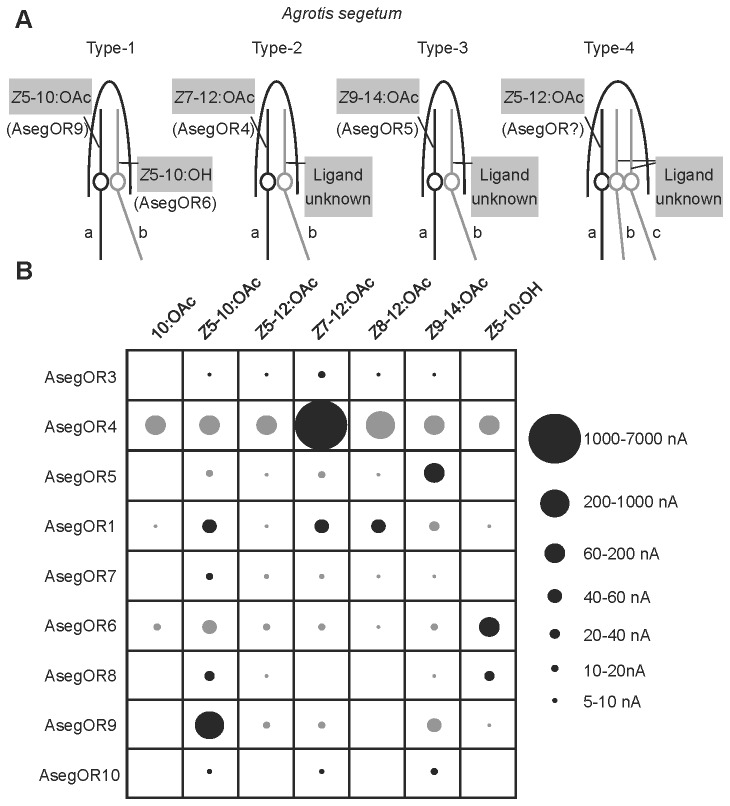
Figure 6. Summary of the response profiles of AsegOR1, AsegOR3-10 and the putative locations of PRs in the ORNs.
(A) Representation of ORNs in trichoid sensilla of A. segetum, depicting suggested associations between PRs and ORNs. The different types of ORNs were identified in previous single-sensillum recordings [11-13]. (B) The response profiles of AsegOR1 and AsegOR3-10 in the presence of seven test compounds at a dose of 100 μM. Circles of different sizes represent the response magnitudes. Black circles indicate the responses of the most active ligand(s) of each receptor, whereas grey circles indicate responses evoked by other stimuli.

