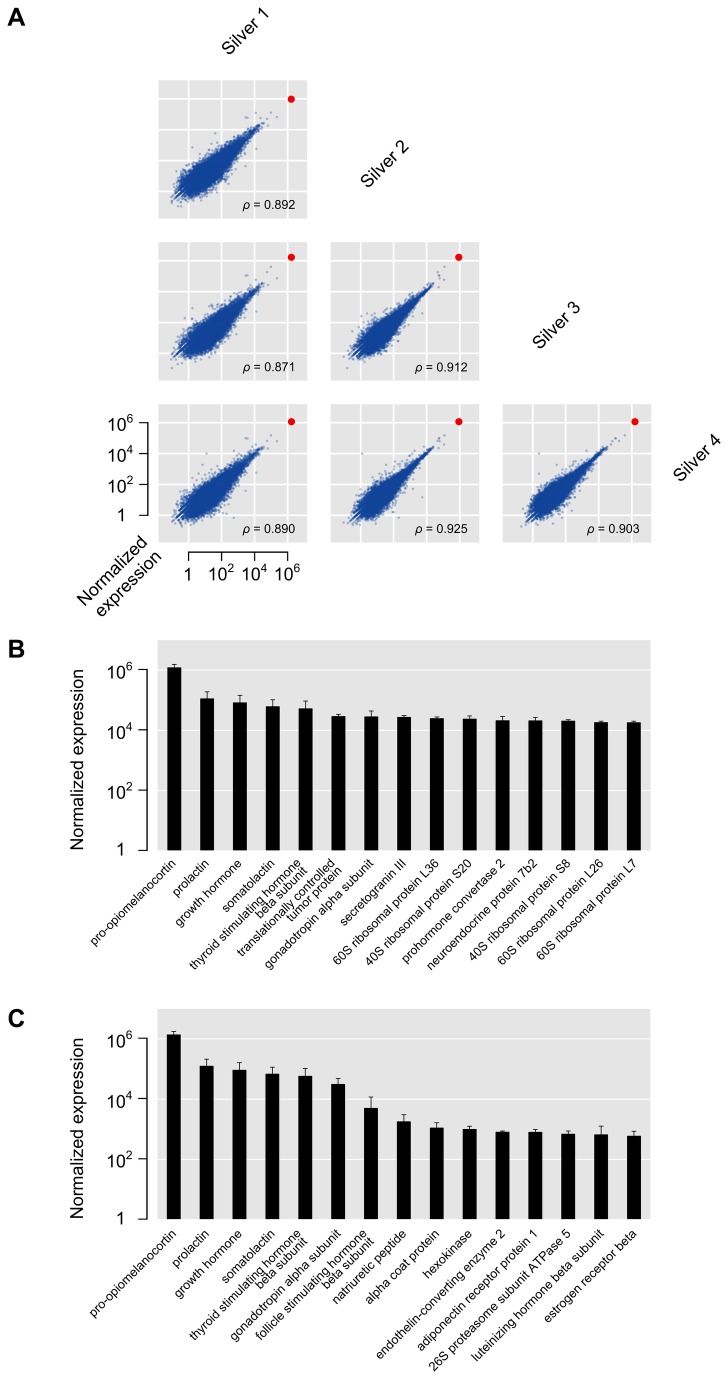
Figure 1. Gene expression in silver eels.
(A): Pairwise comparisons of normalized expression values for all genes between the four silver eel samples (for details, see Materials and methods). The red dot indicates the expression level of pro-opiomelanocortin. Spearman rank correlations (ρ) for the different comparisons show a good correspondence between the expression values for the different silver eel samples. (B): Top 15 expressed genes in silver eel samples, displayed as means of normalized expression ± standard deviations (SD) on a log scale. (C): Top 15 expressed genes in GO category Molecular Function ‘hormone activity’ (GO:0005184), displayed as means of normalized expression ± SD on a log scale.

