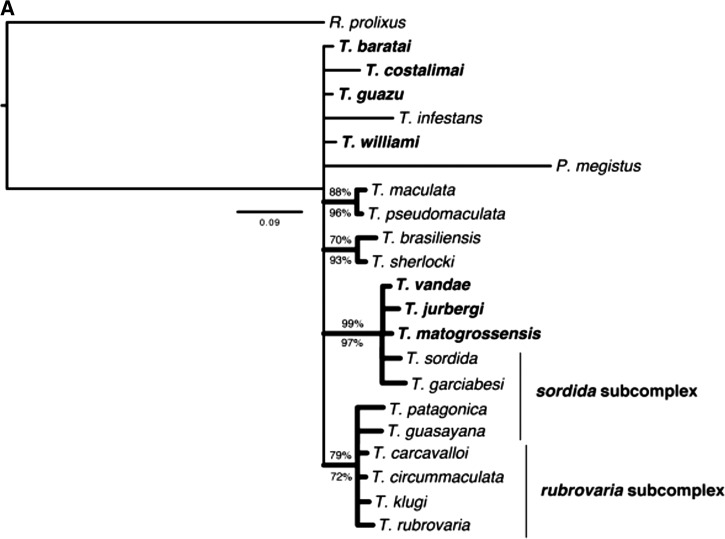
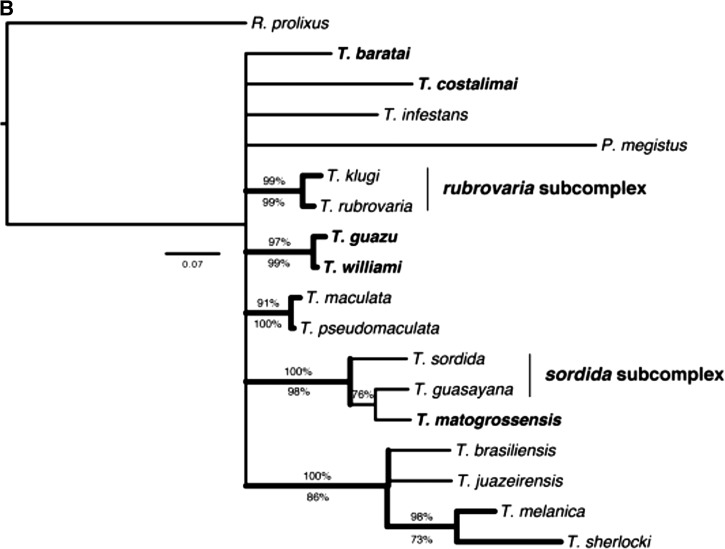
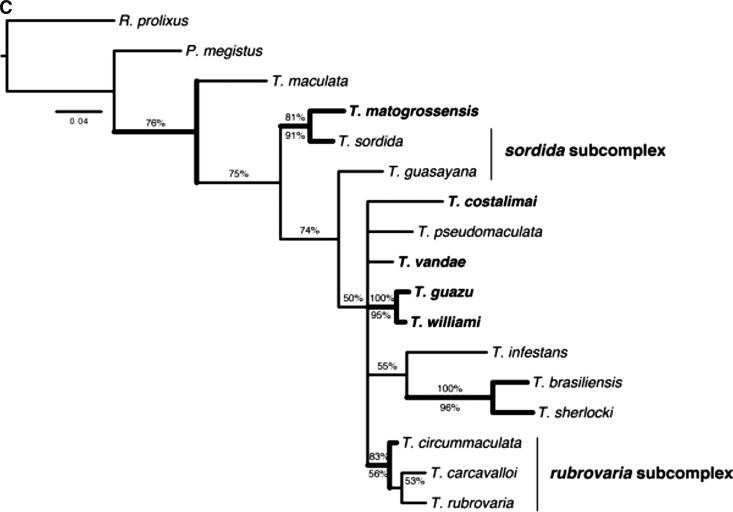
Figure 3.
Bayesian inference consensus for each molecular marker of Triatoma species: ( A) 16S (HKY+I+G), ( B) Cytb (HKY+I+G), and ( C) COI (GTR+I+G). Thick clades represent those also recovered by parsimony. Percentages above the nodes indicate Bayesian posterior probabilities (BPP), whereas those below indicate parsimony bootstrap percentages (PB). Taxa in bold are current members of the T. matogrossensis subcomplex.


