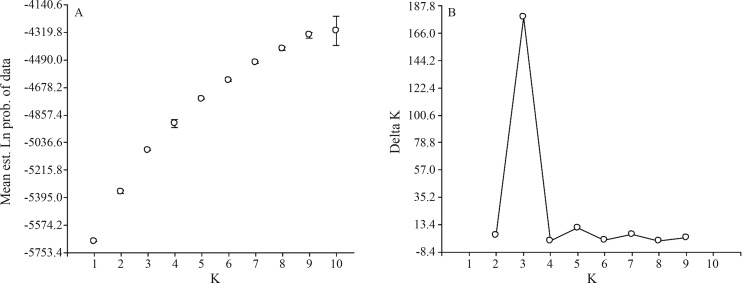
Figure 1.
Population genetic structure analysis of Argentinian wheat germplasm. (A) Mean L(K) (±SD) over 10 runs for each K value. The model considered here is a hierarchical island model using all 102 individuals per population and 38 loci. (B) ΔK calculated as ΔK = m|L″(K)| /s[L(K)]. The modal value of this distribution is the true K or the uppermost level of structure, here 3 clusters.

