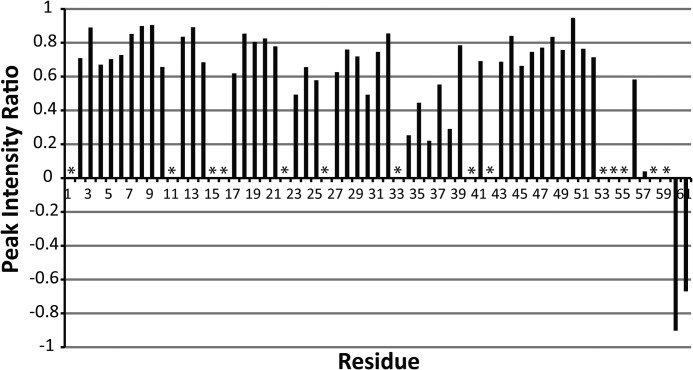
FIGURE 3.
Summary of H-N heteronuclear NOE data. Spectra with and without proton saturation (3s) were acquired. The plot shows the ratio of cross-peak intensities with and without proton saturation. The data were collected at 800 MHz. Asterisks indicate resonances that could not be clearly identified and quantitatively characterized.

