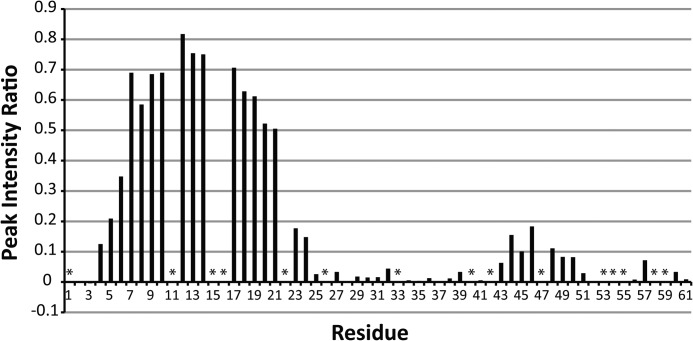
FIGURE 4.
Summary of paramagnetic relaxation by Gd-DTPA. The site-specific reduction in peak intensity upon addition of 4 mm Gd-DTPA to an 15N-labeled sample of GSu PilA is shown. Values near 1 indicate no loss of intensity and protection from Gd-DTPA. No correction was made for the small sample dilution (∼3% maximum) that occurred during the titration. The data were collected at 750 MHz. Asterisks indicate resonances that could not be clearly identified and quantitatively characterized.

