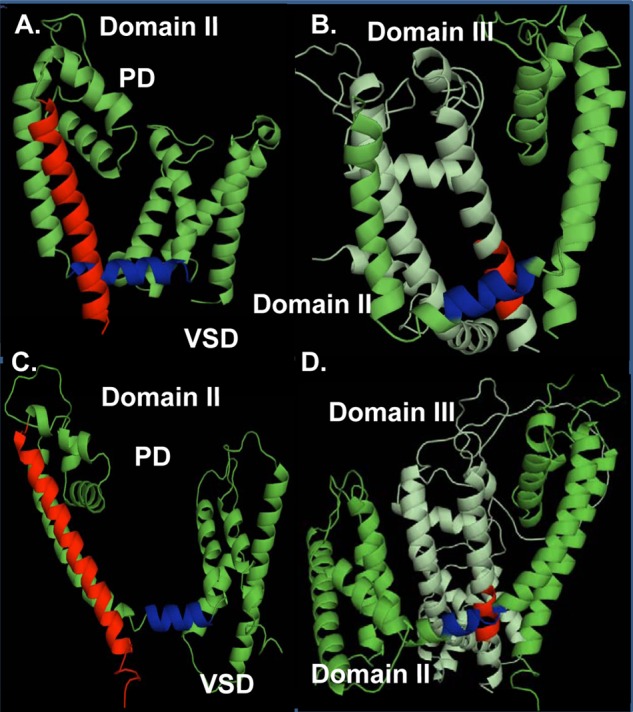
FIGURE 1.

Modeling of Domains II and III was based upon the atomic coordinates of NaVAb (PDB code 3RVY) (panels A and B) and NaVRh (PDB code 4DXW) (panels C and D). Four different views of the computer-based molecular models of Domain II (panels A and C) and Domains II and III (panels B and D) of CaV3.2 are shown in a schematic representation. Modeling was achieved with Modeler 9v4. Panels A and C, the regions in red correspond to the IIS6 and the regions in blue correspond to the IIS4-S5. Panel B and D, the regions in red correspond to the predicted region in the IIIS6 could be interacting with the region in blue in the IIS4-S5. PD, pore domain; VSD, voltage sensor domain. The figures were produced using PyMol (DeLano Scientific).
