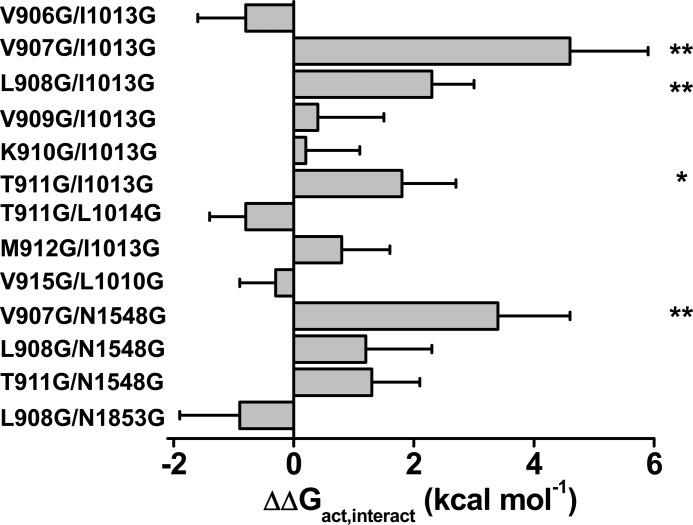
FIGURE 11.
Bar graph of the coupling energies (ΔΔGact,interact) for the double glycine mutants of CaV3.2, ΔΔGact,interact = (ΔGact,WT + ΔGact,double) − (ΔGact,S4-S5 + ΔGact,S6). As seen, the interaction energies were significantly stronger for V907G/I1013G and V907G/N1548G than for any other double mutant. Data are shown in kcal mol−1. Symbols * and ** identify double mutants with interaction energies significantly larger than 1.5 kcal mol−1 at p < 0.05 and p < 0.01, respectively. Numerical values are found in Table 3.

