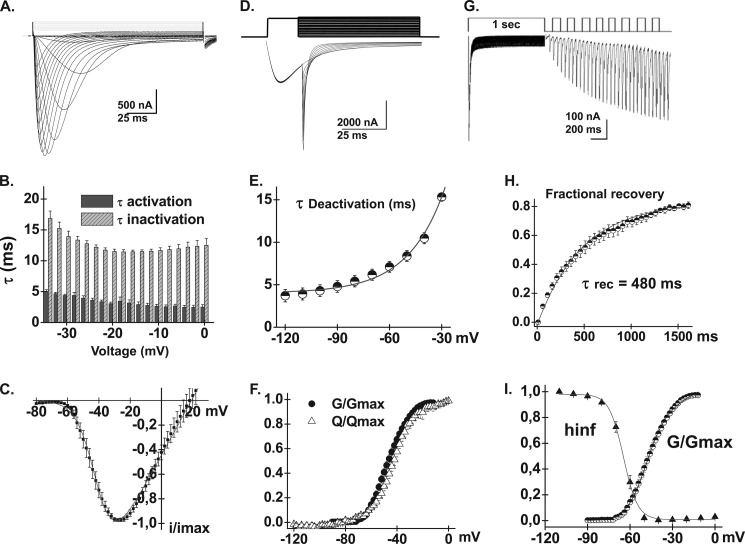
FIGURE 2.
A, whole cell current traces are shown for CaV3.2 WT. Current traces were obtained using the cut-open oocyte technique in 10 mm Ba2+ from a holding potential of −100 mV. Leak subtraction was carried out off-line. B, bar graphs of the mean time constants of activation and inactivation of the CaV3.2 WT are shown as a function of the test potential. Leak-subtracted whole cell current traces were fitted by a sum of two exponential equations, one for the activation and the other one for inactivation (55). C, normalized current-voltage relationships for CaV3.2 WT were obtained by fitting the experimental data to a modified Boltzmann equation. D, representative tail currents for CaV3.2 WT. Currents were activated during 20-ms conditioning depolarizing voltage pulses at −30 mV. Deactivation was recorded during subsequent repolarization to test potentials from −120 to −20 mV (10-mV increments) as illustrated on the pulse protocol. E, the mean time constants of deactivation were obtained from fitting current traces with monoexponential functions. The mean deactivation time constant was 8.4 ± 0.6 ms (n = 9) at −50 mV for CaV3.2 WT. F, normalized gating charge (Q/Qmax) and normalized conductance (G/Gmax) were plotted against the test voltages for CaV3.2 WT. As seen, both curves overlapped in contrast to observations reported in Kv channels where the Q/Qmax is left-shifted as compared with the G/Gmax curve. Mid-points were −44 ± 1 mV (n = 4) for Q/Qmax and −47 ± 1 mV (n = 37) for G/Gmax. G, time course of recovery from inactivation for the CaV3.2 WT. Recovery was measured using a double pulse protocol. A 1-s prepulse to −20 mV induced inactivation and, after a variable period at −100 mV, a test pulse to the same voltage (−20 mV) was applied to assess the extent to which channels had recovered from inactivation. H, data points from panel G were fitted with a single exponential equation of 480 ± 1 ms (n = 10). I, voltage dependence of inactivation for CaV3.2 WT was estimated from isochronal inactivation data points measured after 2-s conditioning pulses applied between −110 and 0 mV from a holding potential of −100 mV. The fraction of the noninactivating current was fitted with a Boltzmann equation yielding E0.5,inact = −65 ± 1 mV (n = 10). Pooled data points are plotted against test voltages and are shown alongside the normalized G/Gmax curve. As seen, a non-negligible window current is predicted between −65 and −50 mV for CaV3.2 WT. Numerical values are found in Table 1.

