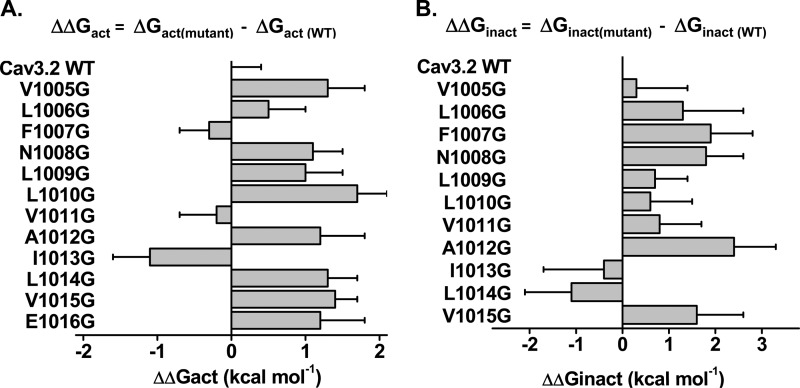
FIGURE 5.
A, bar graph of the activation energies (ΔΔGact) for the glycine mutants in IIS6 of CaV3.2. ΔΔGact were obtained from the difference between the ΔGact values for the mutant channels and the ΔGact values for the WT channel such that ΔΔGact = ΔGact,mutant − ΔGact,WT. As seen, only I1013G activated at voltages more negative than the WT channel. B, bar graph of the inactivation energies (ΔΔGinact) for the glycine mutants in IIS6 of CaV3.2. ΔΔGinact were obtained from the difference between the ΔGinact values for the mutant channels and the ΔGinact values for the WT channel such that ΔΔGinact = ΔGinact,mutant − ΔGinact,WT. As seen, most of the mutations inactivated at voltages significantly more positive than the WT channel. Data are shown in kcal mol−1. Numerical values are found in Table 1.

