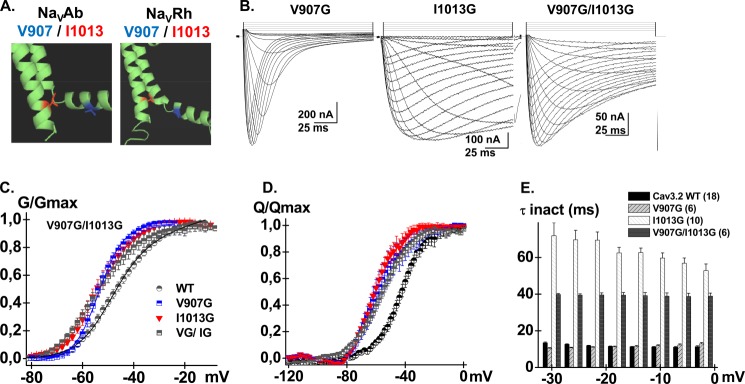
FIGURE 8.

A, computer-based molecular model and Domain II of CaV3.2 are shown in a schematic representation. Modeling of Domain II was based upon the atomic coordinates of NaVAb (PDB code 3RVY) (left panel) and NaVRh (PDB code 4DXW) (right panel). Val-907 (IIS4-S5) is shown in stick representation in blue and Ile-1013 (IIS6) is shown in red. B, whole cell current traces are shown from left to right for CaV3.2 V907G, I1013G, and the double mutant V907G/I1013G. Current traces were obtained in 10 mm Ba2+ from a holding potential of −100 mV. C, normalized conductance (G/Gmax) for CaV3.2 WT (black circles), V907G (blue squares), I1013G (red triangles), and V907G/I1013G (black squares) are plotted against the test voltages. D, normalized gating charge (Q/Qmax) was plotted against voltage plot for CaV3.2 WT (black circles), V907G (blue squares), I1013G (red triangles), and V907G/I1013G (black squares). Mid-points of charge movement Q/Qmax were −44 ± 1 mV (n = 4) for WT, −57 ± 4 mV (n = 6) for V907G, −56 ± 2 mV (n = 5) for I1013G, and −57 ± 2 mV (n = 6) for V907G/I1013G. E, bar graphs of the mean time constants of inactivation for CaV3.2 WT (black), V907G (pale gray), I1013G (white), and V907G/I1013G (dark gray) as a function of the test potential. Numerical values are found in Tables 1–3.
