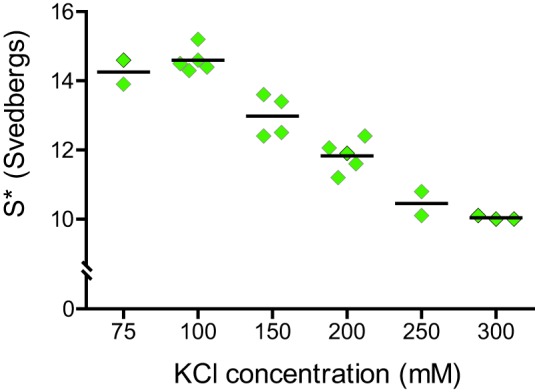
FIGURE 3.

Salt-dependent conformational transition of myoVa. Analytical ultracentrifugation was used to follow the ionic strength dependence of the folded, inhibited conformation (∼14 S) to the active, extended (∼10 S) form. Intermediate S values represent an equilibrium between bent and extended molecules. Individual data points represent separate experiments. Horizontal bar indicates the average value.
