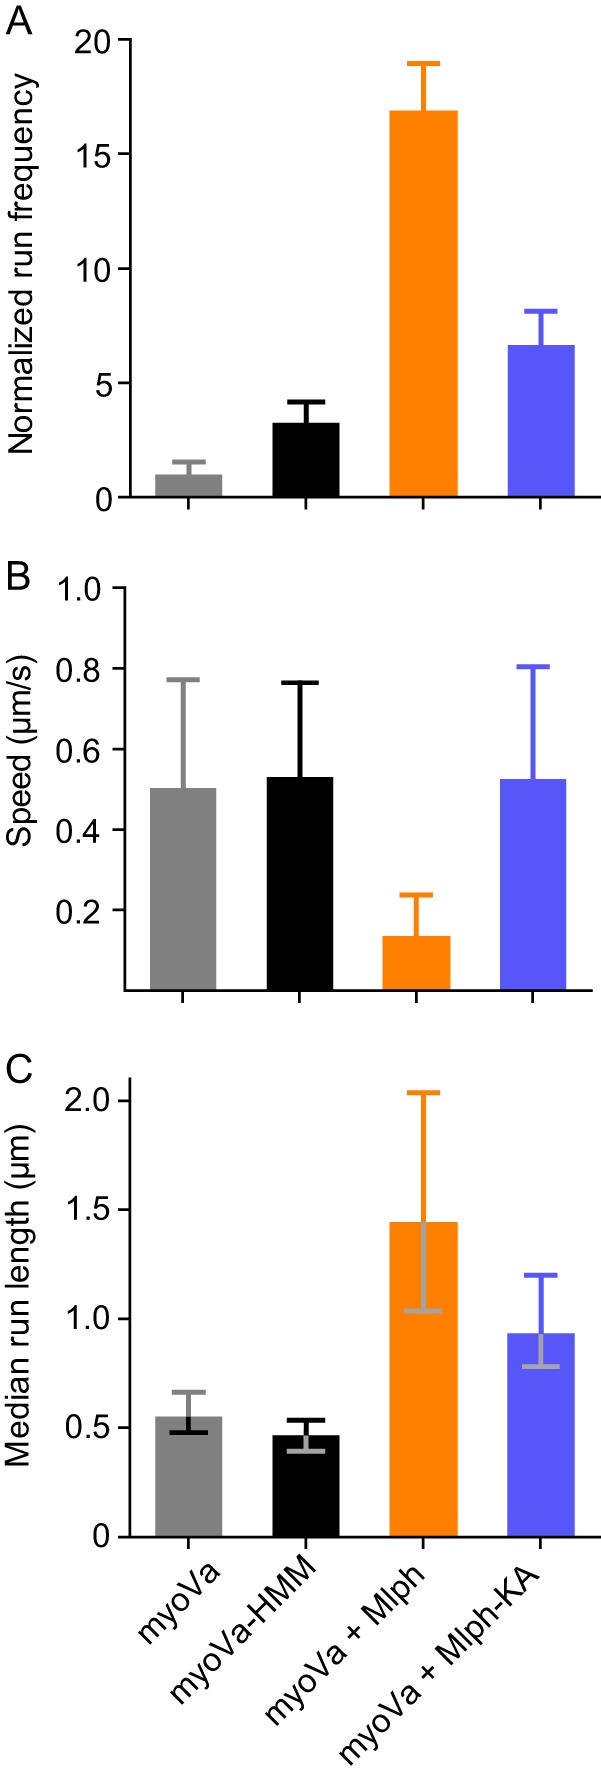
FIGURE 6.

Comparison of single-molecule properties with different motors and different Mlph constructs. A, normalized frequency of motors starting to move within a fixed time frame and area. Values are normalized to actin length and number of runs with myoVa under the same conditions. Error bars are S.D. For myoVa-HMM versus myoVa-Mlph-KA, p < 0.01; all other pairs, p < 0.001. B, mean speed as determined by the fit of a Gaussian distribution to the histogram. Error bars are S.D. Differences between myoVa-Mlph and all other constructs are statistically significant (t test, p < 0.001). C, median run length as determined by Kaplan-Meyer survival statistics. Error bars are 95% confidence intervals. Difference between myoVa-HMM and myoVa is not significant. All other differences are statistically significant (log-rank test). For myoVa-Mlph versus myoVa-Mlph-KA, p < 0.01; all other pairs are p < 0.001.
