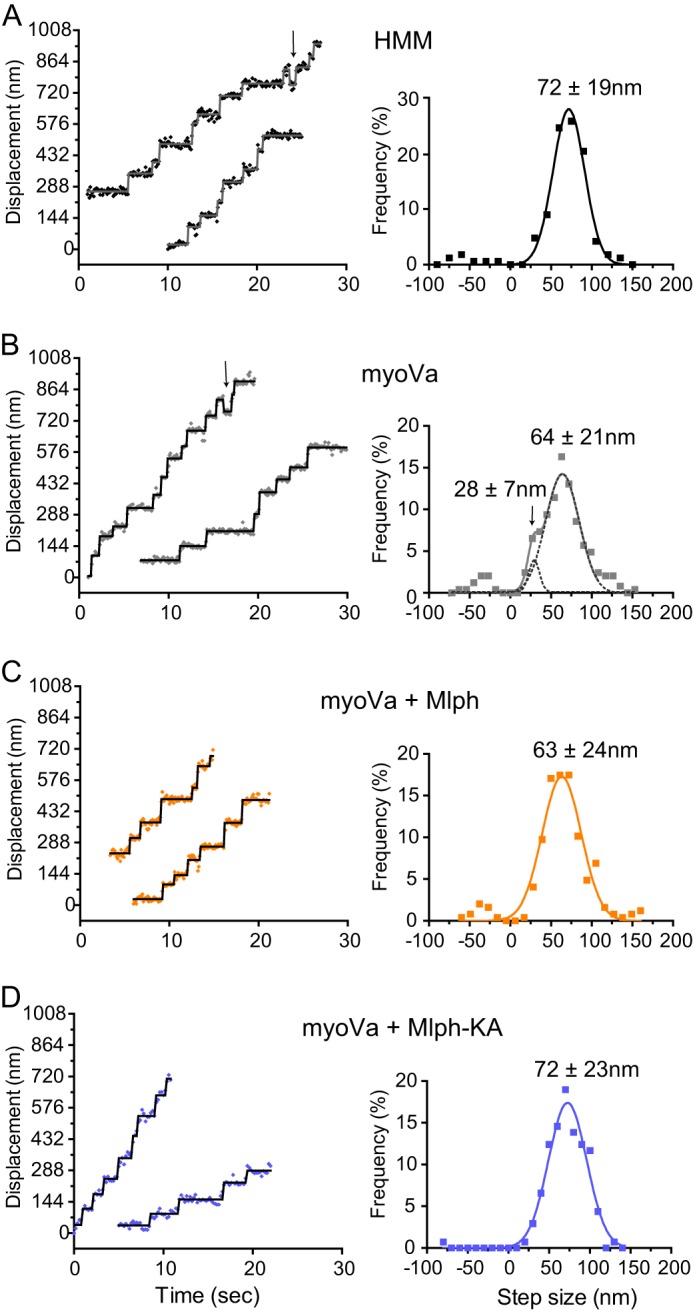
FIGURE 8.

Stepping pattern of myoVa in the presence or absence of Mlph. Representative displacement versus time traces and histograms of step sizes fit with Gaussian distributions are shown. A, myoVa-HMM has a mean step size of 71.9 ± 19.4 nm (n = 161) and shows occasional back steps (arrow). B, myoVa shows two step populations with average sizes of 27.8 ± 6.5 nm and 64.0 ± 20.5 nm (n = 245). Dashed line shows the individual Gaussian fits to the slower shoulder and main peak. Arrow in the left panel points to a back step. C, in the presence of Mlph the distribution becomes uniform with an average step size of 63.0 ± 24.0 nm (n = 246). D, in the presence of Mlph-KA step sizes are uniform and show the same size as myoVa-HMM (71.7 ± 22.4 nm, n = 137). Conditions: 150 mm KCl, pH 7.4, 2–4 μm MgATP.
