
FIGURE 2.
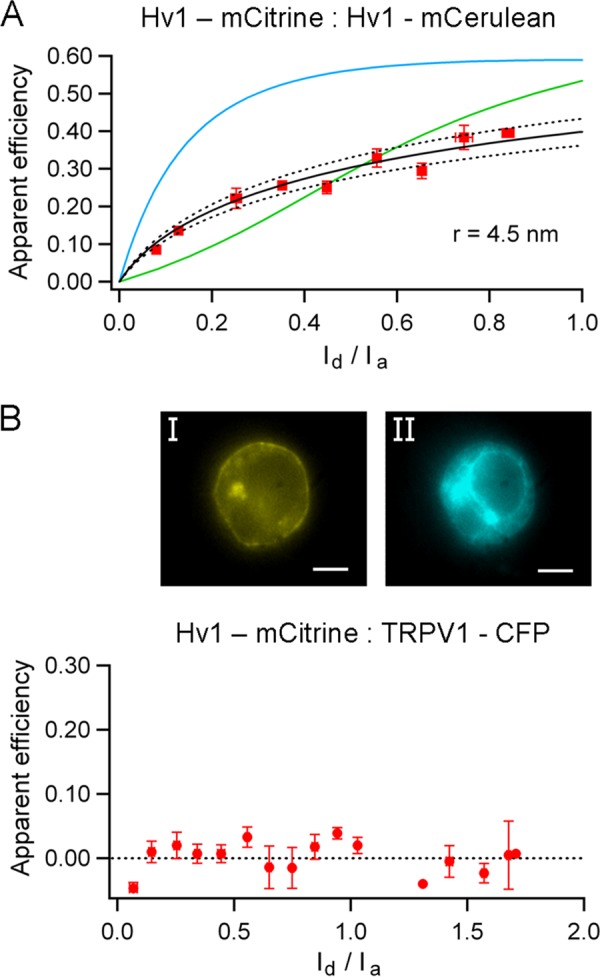
FRET in C-terminal constructs. A, FRET between mCitrine and mCerulean at the C terminus of the Hv1 channel. The black solid and dotted lines are the predictions for a 4.5 ± 0.2 nm interfluorophore distance for a single FRET pair, according to Equations 9 and 10 with T = 2. The blue and green lines are predictions for a tetramer and a trimer, respectively, with the same interfluorophore distance. B, cotransfection of Hv1-mCitrine and TRPV1-CFP subunits yields no FRET. The top images show the differential expression of Hv1 (panel I) and TRPV1 (panel II) in the same HEK 293 cell. The scale bars are 10 μm.