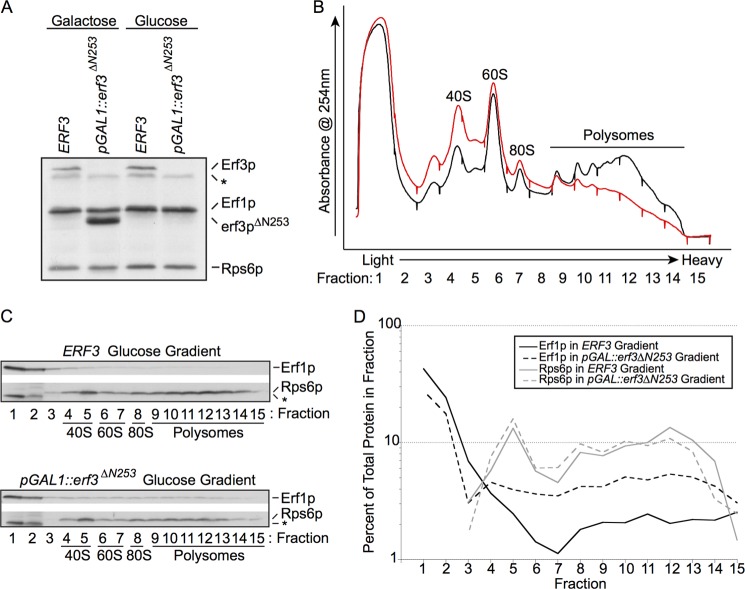
FIGURE 4.
Depletion of eRF3 in vivo results in redistribution of eRF1 on polysome gradients. A, Western blot analysis of total cellular lysates prepared from wild type ERF3 (the SUP35 gene) and pGAL1::erf3ΔN253 strains grown for 8 h in galactose (permissive for both) or glucose (erf3ΔN253 depletion). Equal A260 units of each lysate were loaded on the gel. The asterisk indicates a background band. B, cellular lysates prepared from wild type ERF3 (black line) and pGAL1::erf3ΔN253 (red line) strains grown for 8 h in glucose (erf3pΔN253 depletion). Equal A260 units of each lysate were separated on sucrose density gradients as described under “Experimental Procedures.” Absorbance peaks (254 nm) that correspond to the ribosomal 40S and 60S subunits as well as 80S monosomes and polysomes are indicated. Fraction 1 is the top of the gradient, and fraction 15 is the bottom of the gradient. C, Western blot analysis of the sedimentation of eRF1 and Rps6p during sucrose gradient analysis of wild type ERF3 and pGAL1::erf3ΔN253 strains grown in glucose. The asterisk indicates a background band observed in fractions 1 and 2 prior to detection with the rpS6 antibody. D, quantitation of the percent of total protein found in each sucrose gradient fraction for the Western blots shown in B.

