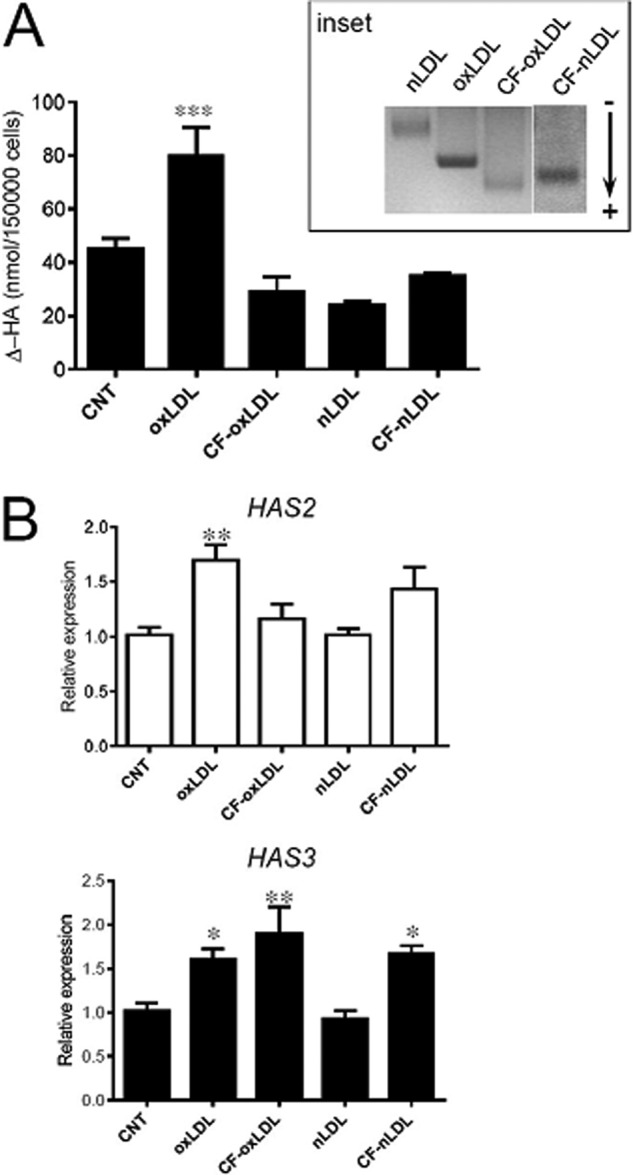
FIGURE 4.

HAS expression depends on oxidized sterol-related species in oxLDL. A, quantification by HPLC analysis of Δ-HA disaccharides of hyaluronidase digests of HA secreted in culture medium of controls (CNT) and treated AoSMC as indicated (20 μg of proteins each). Values are mean ± S.E. of triplicates of three independent experiments, ***, p = 0.001. Electrophoretic mobility of nLDL, oxLDL, and cholesterol-free LDL forms on agarose gel are shown in the inset, and the direction of migration is indicated by an arrow. B, quantitative RT-PCR analysis of HAS2 and HAS3 expression of samples depicted in A. Results are expressed as relative expression of HAS3 and HAS2 for each gene with respect to its control (CNT). Values are mean ± S.E. of three independent experiments, *, p < 0.05, **, p < 0.01.
