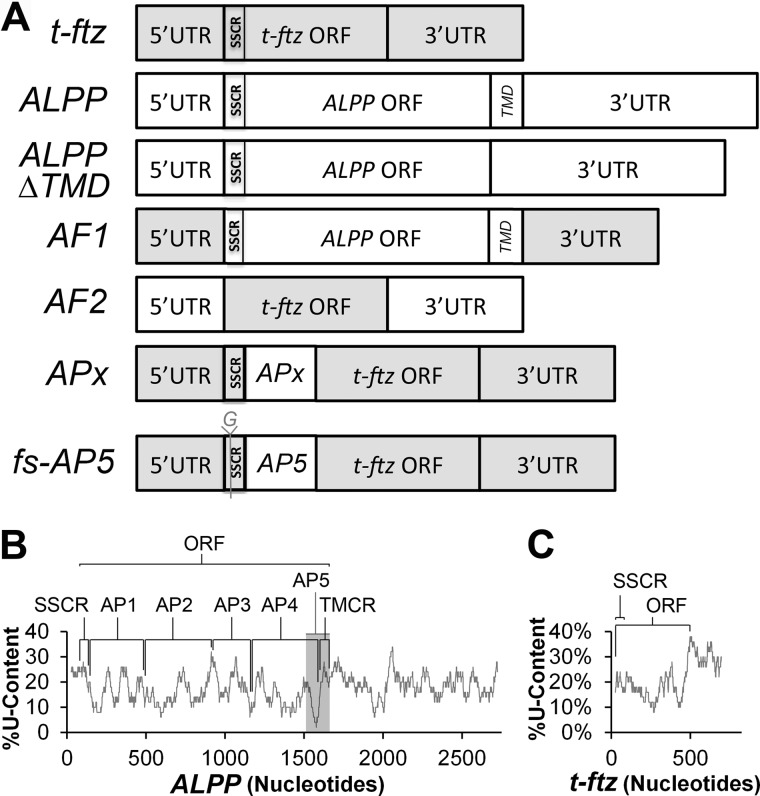
FIGURE 1.
Schematic diagrams of constructs and U content in ALPP and t-ftz. A, schematic of the chimeric constructs used in this study. All t-ftz sequences are depicted in gray and ALPP sequences in white. SSCRs and TMCRs are also indicated. B, percentage of U content in ALPP, as analyzed using a moving window of 50 nucleotides, plotted against the length of the construct. The SSCR, ORF, TMCR, and various fragments (AP1–5) are indicated. Note that the gray region represents AP5. C, percentage U content in t-ftz, as analyzed using a moving window of 50 nucleotides.

