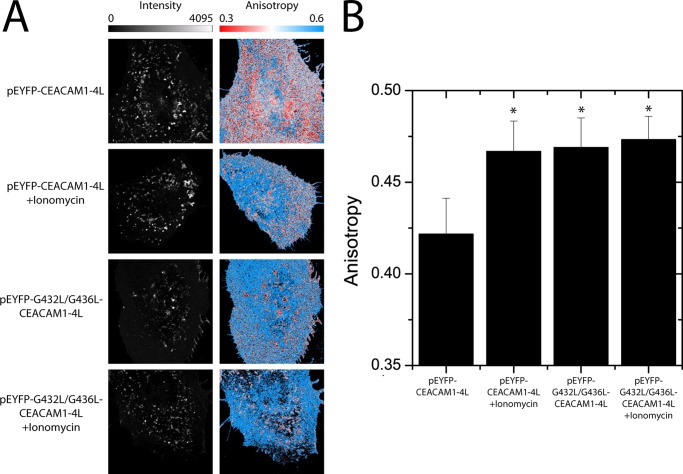
FIGURE 6.
FAIM reveals varied oligomerization of CEACAM1–4L and G432L/G436L-CEACAM1–4L. Fluorescence anisotropy measurements were made on HeLa cells expressing enhanced YFP-CEACAM1–4L and enhanced YFP-G432L/G436L-CEACAM1–4L with and without ionomycin treatment. A, intensity images (left column) show similar expression and distribution of wild type and mutant CEACAM1 on the plasma membrane. A comparison of the anisotropy images (right column) show that ionomycin treatment increases the anisotropy of CEACAM1–4L-YFP, indicating that there is an increase in the proportion of CEACAM1 that is in monomeric form. Anisotropy images for the untreated G432L/G436L mutant reflect that seen with ionomycin-treated CEACAM1, and this is not affected by exposure to ionomycin. B, summarized anisotropy values for CEACAM1–4L-YFP and G432L/G436L-CEACAM1–4L-YFP with and without ionomycin. The data represent the mean ± S.E. from measurements on 30 or more cells collected from six independent experiments. Asterisk indicates a p value of <0.05 by a Student's t test compared with the CEACAM1–4L-YFP.

