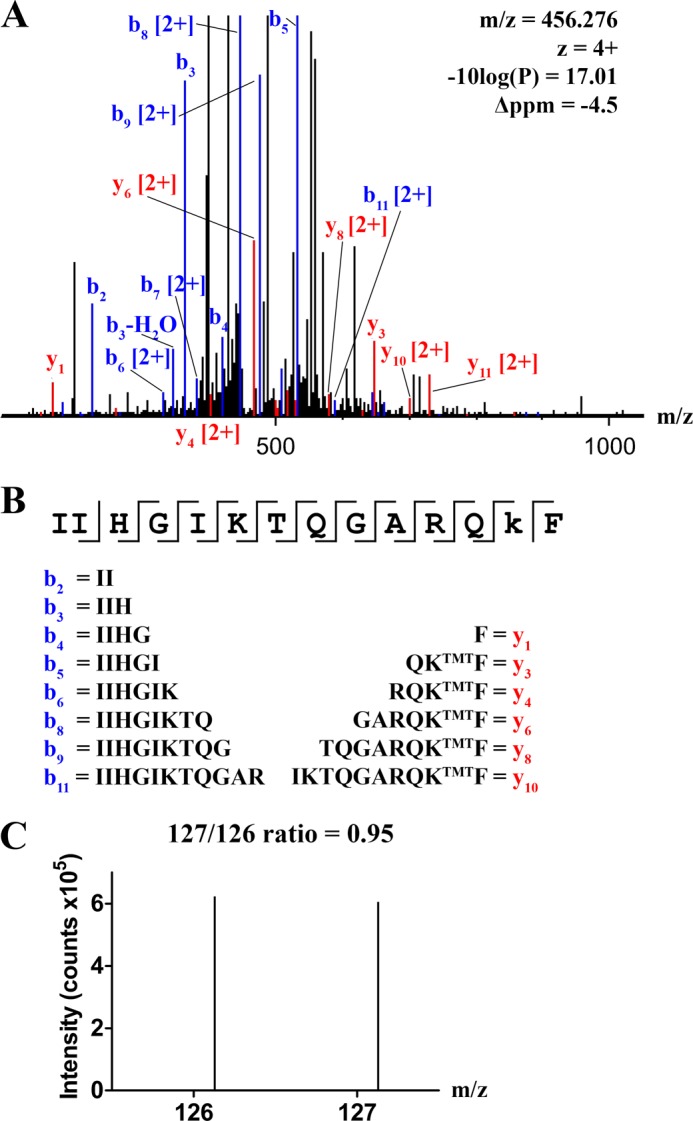
FIGURE 8.

Surface exposure of Lys-2092 in normal FVIII and FVIII-R2159N. FVIII-WT and FVIII-R2159N were labeled with TMT tags and analyzed by mass spectrometry as described under “Experimental Procedures.” A, the collision-induced dissociation fragmentation spectrum of peptide 2080-IIHGIKTQGARQKTMTF-2093. Y ions are displayed in red and recovered b ions in blue. Values of m/z, z, −10log(P), and Δppm are indicated. B, the peptide sequence, including the assigned y and b ions. C, higher energy collision-induced dissociation fragmentation spectrum of peptide 2080-IIHGIKTQGARQKTMTF-2093. The peaks at m/z 126.13 and 127.13 represent the labeling efficiency of Lys-2092 in FVIII-WT and FVIII-R2159N, respectively.
