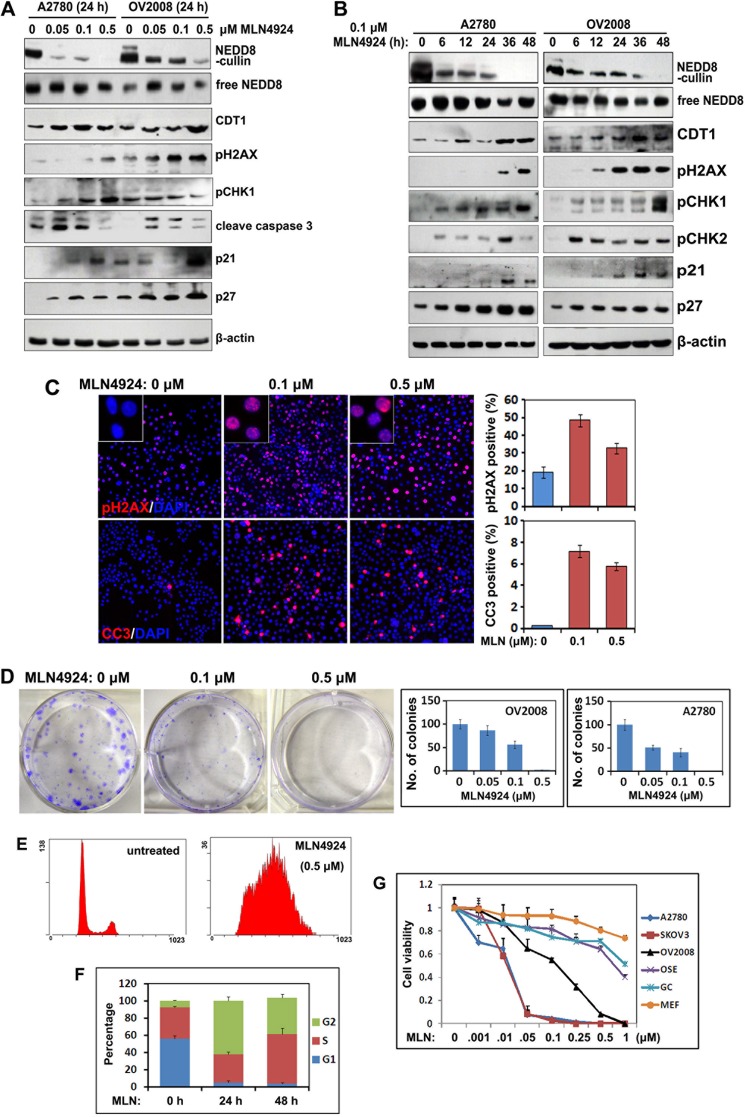
FIGURE 2.
Effects of MLN4924 treatment on ovarian cancer cell growth, apoptosis, and DNA damage. A, Western blot results for the changes in the levels of the indicated proteins in ovarian cancer cells (A2780 and OV2008) treated with increased concentrations of MLN4924 for 24 h. B, Western blot results showing the changes in the levels of the indicated proteins in ovarian cancer cells (A2780 and OV2008) treated with 0.1 μm MLN4924 for increased periods of time. C, immunofluorescent staining results showing increased pH2AX and cleaved caspase 3 (CC3) levels at 24 h after treatment with 0.1 or 0.5 μm MLN4924. The percentages of pH2AX and CC3 positive cells were determined by counting the total cells in 10 independent areas. D, colony formation assay for OV2008 and A2780 cells after treatment with 0.1 or 0.5 μm MLN4924. Colony numbers were counted after 10 days in culture. E and F, cell cycle phase determined by flow cytometry. OV2008 cells (1 × 10⁵ cells per 60-mm dish) were cultured overnight, treated with or without MLN4924 (0.5 μm), and then subjected to PI staining and FACS analysis at the indicated time points. The percentages of cells in the G1, S, and G2/M phases are indicated. G, sensitivity to MLN4924 by different cancer cell lines (SKOV3, OV2008, and A2780) and normal cells (mOSEs, MEFs, and GCs). Cells were seeded in 96-well plates in triplicate and treated with increased concentrations of MLN4924 for 72 h, followed by MTT assay.

