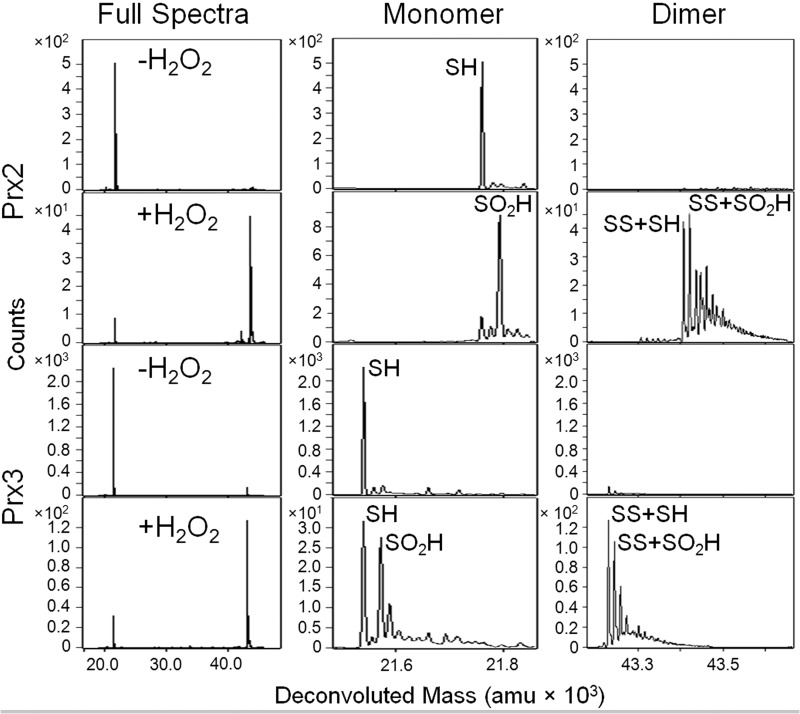
FIGURE 2.
Susceptibility of wild-type Prx2 and Prx3 to hyperoxidation. Chemical quench and ESI-TOF MS were used to assess the oxidation state of each protein (50 μm) following treatment with 0.8 eq of H2O2 for 30 s at pH 7.5. The 1st column of panels shows the full spectra for Prx2 and Prx3 with and without H2O2 treatment. The panels to the right show a close-up view of the mass ranges encompassing the monomeric and dimeric species. See Fig. 1A for the abbreviations used for each species. All theoretical and experimental mass values (± S.D.) are given in Table 1; amu, atomic mass units.

