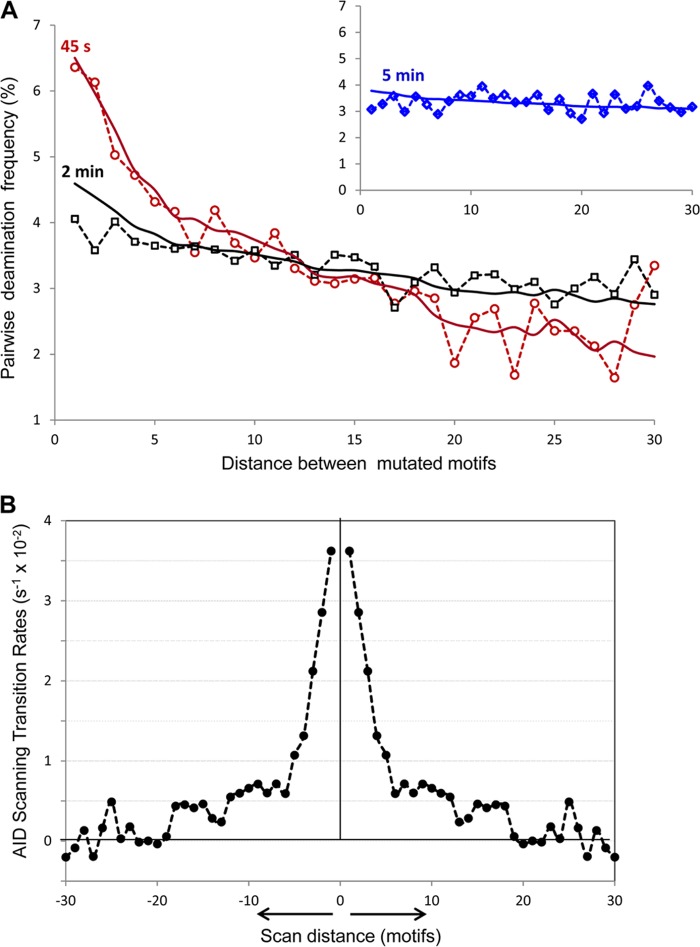
FIGURE 3.
Analysis of AID scanning by two-point correlation function. A, distribution of pairwise deaminations separated by 1–30 motifs in experimental clones with ≥2 mutations at 45 s (open red circles), 2 min (open black squares), and 5 min (open blue diamonds, inset). Solid lines represent the predicted pairwise distributions at 45 s (red), 2 min (black), and 5 min (blue, inset), using the two-point correlation function (Equation 5) with the AID scanning matrix W shown in B. B, AID scanning matrix (W) obtained from inverted experimental data. 0 on the x axis denotes the initial position of the enzyme on ssDNA. The y axis shows the AID transition rates from the initial position 0 to positions on the left and on the right at distances ranging from 1 to 30 motifs (3–90 nt). The negative transition rates originate from noise in the data at long scan distances (>20 motifs). These are shown because they are required in the calculation to conserve total probability.

