
FIGURE 4.
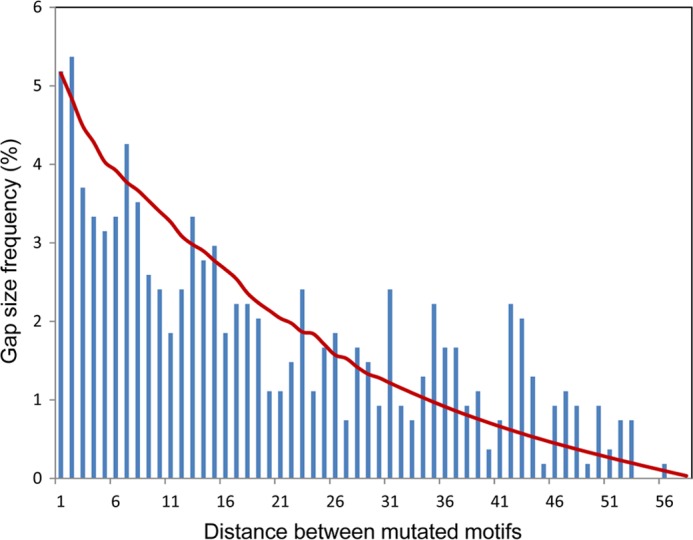
Distribution of the gap distances between two consecutive deaminations in experimental clones with exactly 2 mutations. The red line represents the gap distance distribution predicted from the Laplace transform of the propagator K coming from the scanning matrix W (Fig. 3B) and deamination efficiency of 2%.