
FIGURE 5.
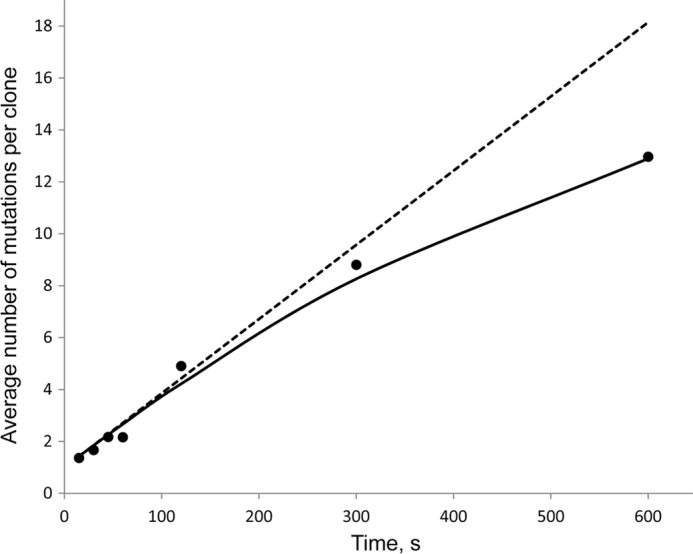
Time-dependent accumulation of AID-catalyzed mutations (black circles) on deaminated clones. The linear rise in the average number of deaminations per clone from 15 to 120 s indicates a long lifetime of AID on ssDNA and corresponds to AID deamination rate of 1 deamination per 35 s (0.029 s−1). The solid line represents the predicted average numbers of deamination per clone if AID remains bound to ssDNA for the duration of the experiment and deaminates the 56-motif cassette with a rate of ∼0.03 s−1 when the “target saturation effect” was considered. The dashed line represents the predicted values without considering the “target saturation effect.”