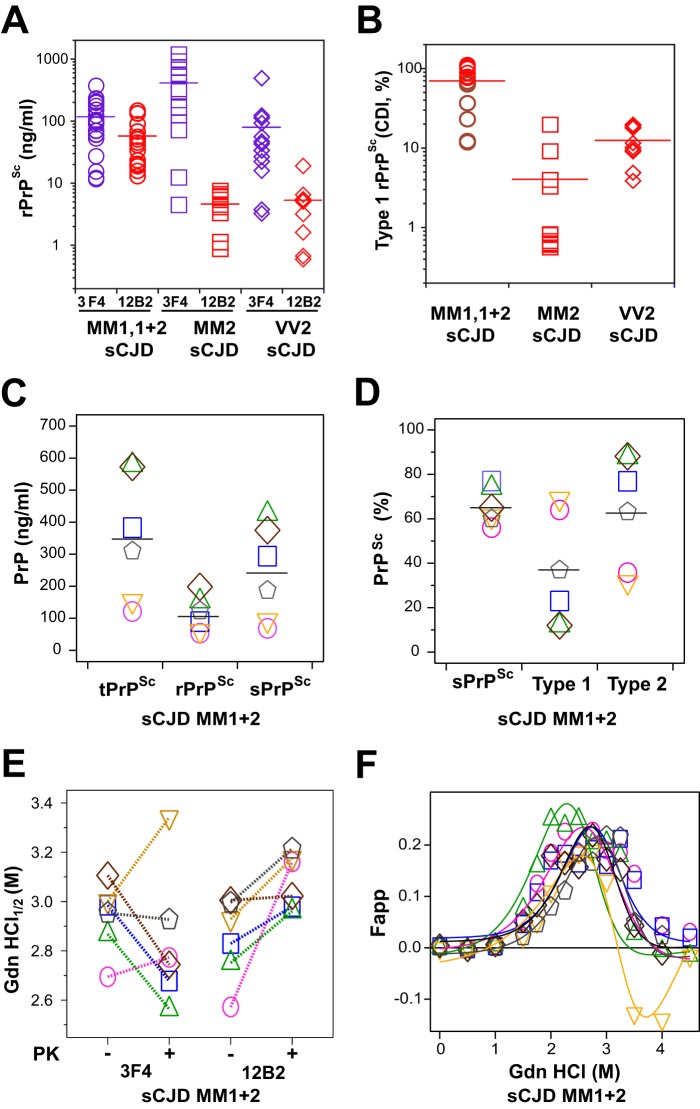
FIGURE 2.
Concentration and dichotomous impact of PK treatment on the conformational stability of PrPSc isoforms in the cortex of sCJD with mixed type 1 + 2 PrPSc in the same location. A, concentration of total and type 1 rPrPSc in the cortex of 36 cases of sCJD homozygous for different codon 129 polymorphisms and with WB classification of MM type 1 (n = 10), MM type 2 (n = 10), VV type 2 (n = 10), and MM type 1 + 2 (n = 6) rPrPSc in the same location. B, relative proportion of type 1 rPrPSc in each codon 129 polymorphism and WB classification group; the sCJD cases MM type 1 + 2 (n = 6) studied in detail in this paper are depicted as brown circles. C, concentrations of total PrPSc (purple circles), rPrPSc (black circles), sPrPSc (green diamonds). D, relative proportion of sPrPSc (green diamonds), type 1 (red triangles), and type 2 (blue triangles) in each sCJD case (n = 6). E, distinct conformational stability of total rPrPSc, type 1 rPrPSc, and incongruent impact of proteinase K treatment (−/+). The same color symbols and links indicate data obtained in the same mixed case of sCJD. F, differential stability curves of type 2 rPrPSc obtained after subtracting stability curves of type 1 rPrPSc obtained with mAb 12B2 from stability curves of total rPrPSc obtained with mAb 3F4 after PK treatment. The CDI with europium-labeled mAb 3F4 was used to determine the concentration and stability of total PrPSc and mAb 12B2 to measure the concentration and stability of type 1 rPrPSc. Each data point represents a unique patient measured in triplicate, and the concentration of PrPSc in 10% brain homogenate was calculated; the percentage of rPrPSc or type 1 is expressed over total rPrPSc. The horizontal line represents mean for each parameter.

