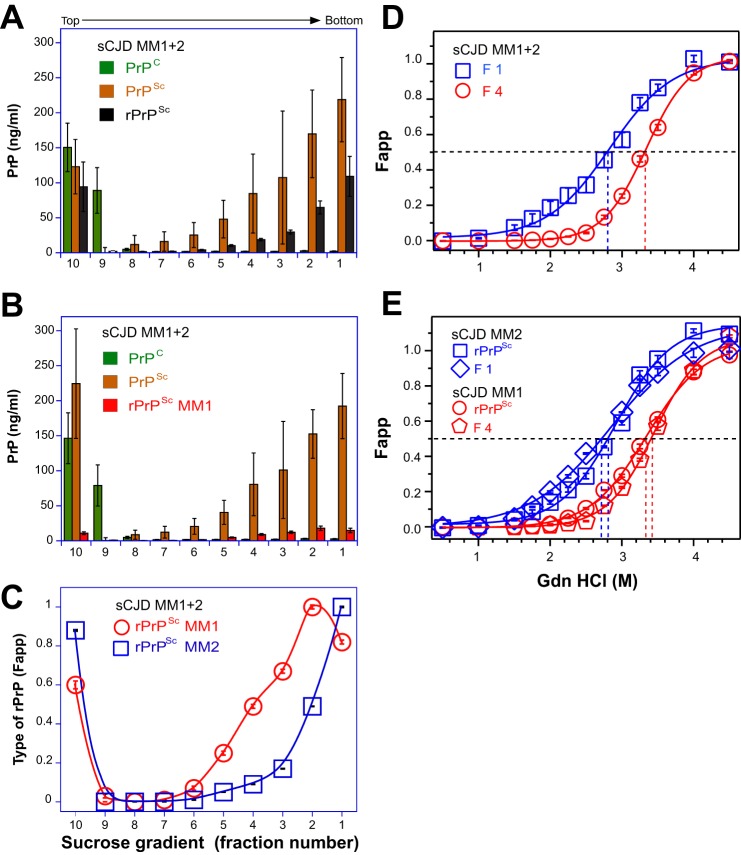
FIGURE 4.
Sedimentation velocity fractionation and conformational stability of PrPs monitored with CDI in sCJD cases with mixed type 1 + 2 rPrPSc. A, concentrations of PrPC (green bars), total PrPSc (brown bars), and rPrPSc (black bars) determined with europium-labeled mAb 3F4. B, concentration of type 1 rPrPSc (red bars), PrPC (green bars), and total PrPSc (brown bars) determined with europium-labeled mAb 12B2. C, relative proportion of type 1 (red circles) and type 2 (blue squares) rPrPSc. D, representative conformational stability curve of type 1 rPrPSc obtained in fraction 4 (red circles) and type 2 rPrPSc (blue squares) obtained in fraction 1 of the sucrose gradient of mixed type 1 + 2 sCJD. E, typical conformational stability curves of pure type 1 rPrPSc of MM1 sCJD and type 2 rPrPSc of MM2 sCJD that were mixed in vitro. The original MM1 sCJD rPrPSc before (red circles) and fraction 4 after mixing and sucrose gradient separation (red pentagons) are shown; the original MM2 sCJD rPrPSc before (blue squares) and fraction 1 after mixing and sucrose gradient separation (blue diamonds) are shown. The fractions were obtained from the frontal (n = 3) or occipital (n = 3) cortex of six mixed type 1 + 2 sCJD cases. The total rPrPSc was measured with europium-labeled mAb 3F4, type 1, with europium-labeled mAb 12B2, and the difference is type 2 rPrPSc. The bars and data points are an average ± S.E. obtained in six cases each measured in triplicate with CDI before and after PK treatment as described in the legend for Fig. 3.

