
FIGURE 2.
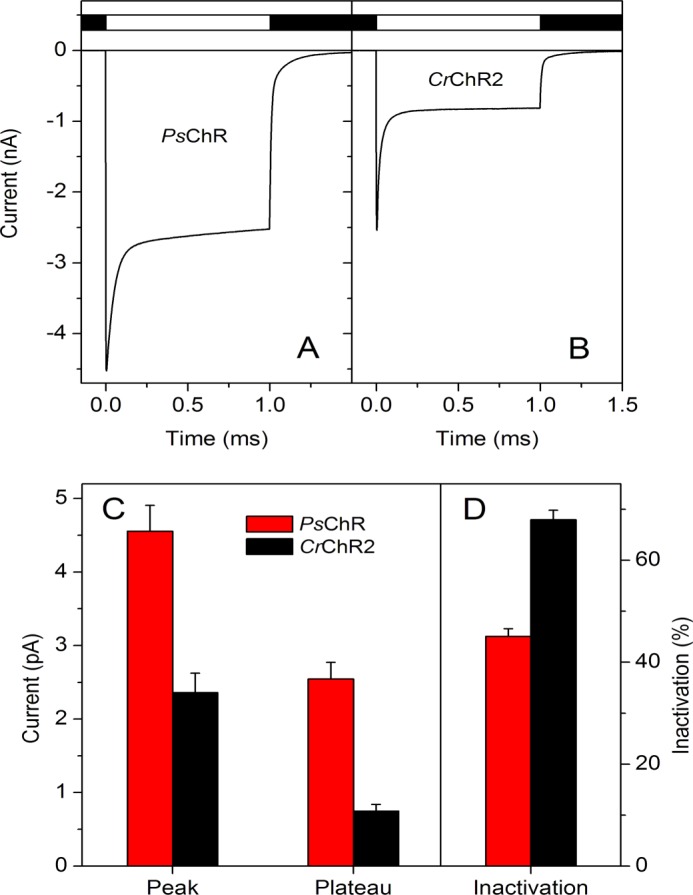
A and B, photocurrents generated by PsChR (A) and CrChR2 (B) expressed in HEK293 cells in response to a light pulse of saturating intensity (440 and 470 nm, respectively). The duration of the pulse is shown schematically on top. C and D, the mean amplitudes of peak and plateau currents (C) and the degree of current inactivation (D) for PsChR (n = 27 cells) and CrChR2 (n = 20 cells).