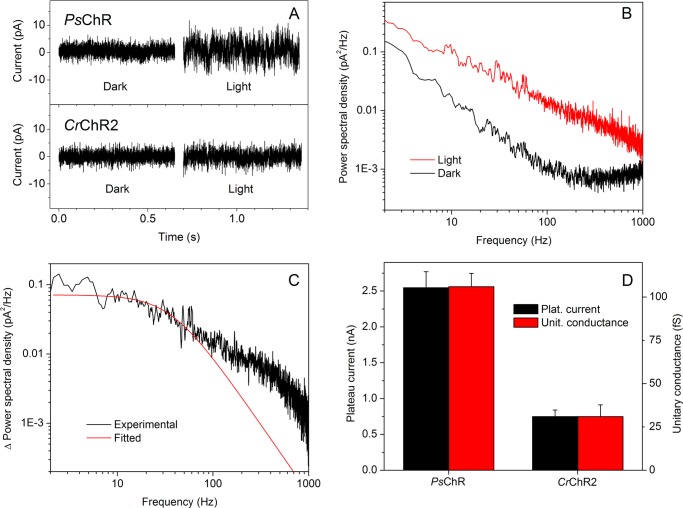
FIGURE 3.
A, whole cell current noise generated by PsChR (top) and CrChR2 (bottom) in the dark and under continuous illumination. B, noise power spectra calculated for the dark (black line) and light (red line) conditions of currents generated by PsChR. The spectra were smoothed by five-point adjacent averaging for presentation purposes. Other details are under “Experimental Procedures.” C, the difference spectrum (light minus dark) calculated from the spectra shown in B (black line) and its single Lorentzian fit (red line). D, plateau currents measured after 1-s illumination (left axis; same as in Fig. 2C) and unitary conductances (right axis) of PsChR and CrChR2. The data are the mean values calculated from 12 individual current traces for PsChR and 8 traces for CrChR2.

