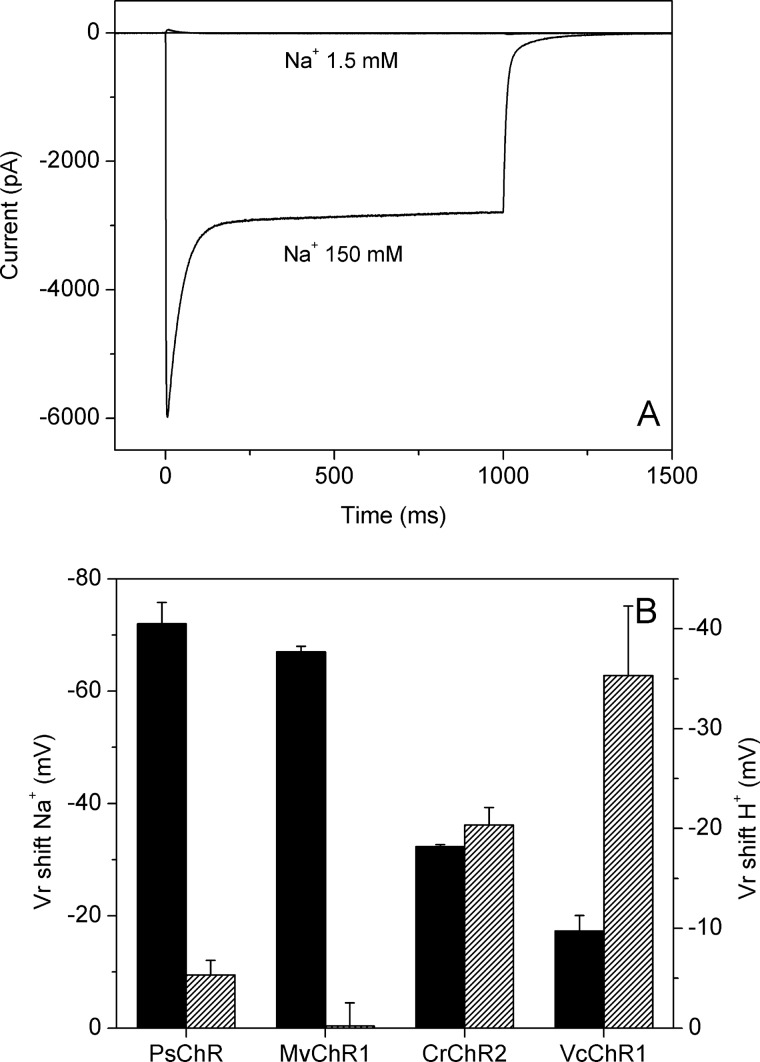
FIGURE 5.
A, photocurrents generated by PsChR in the same HEK293 cell at 150 and at 1.5 mm Na+ and 148.5 mm nonpermeable N-methyl-d-glucamine in the bath (1-s light stimulus, 440 nm). B, shifts of Vr measured for plateau currents after a decrease in the bath Na+ concentration from 150 to 1.5 mm (left axis, solid bars), or an increase in the bath pH from 7.4 to 9 (right axis, hatched bars). The data points are the mean values obtained from three cells.

