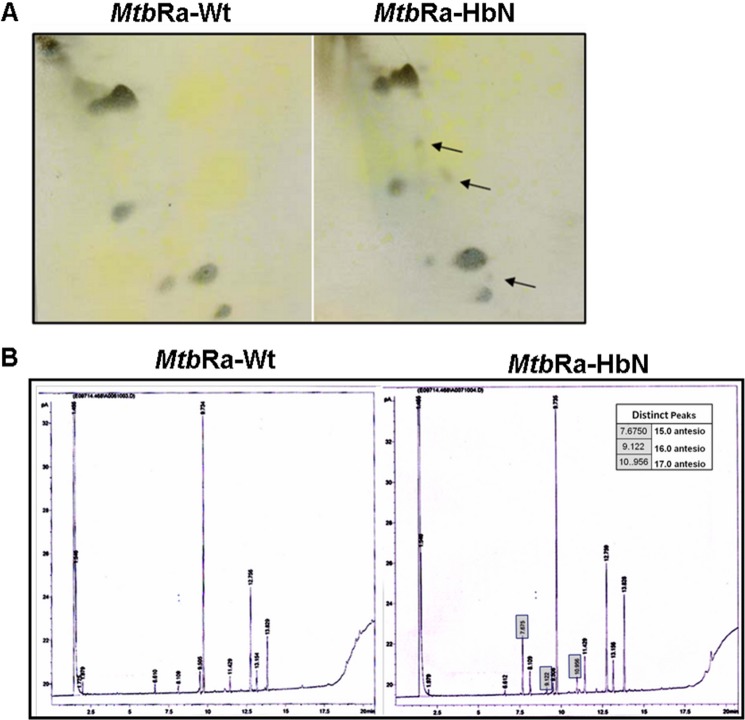
FIGURE 2.
Lipid profile of native and HbN-overexpressing cells of MtbRa. A, two-dimensional TLC analysis of polar lipids of cell membrane in wild type and HbN-expressing MtbRa. The arrow indicates the up-regulated/newly appeared lipids in the cell wall. B, fatty acid methyl ester analysis of wild type (MtbRa-Wt) (left) and HbN-overexpressing (MtbRa-HbN) (right) cells of MtbRa. Some of the prominently up-regulated new fatty acids in the membrane lipids of HbN-overexpressing cells of MtbRa are shown in boxes.

