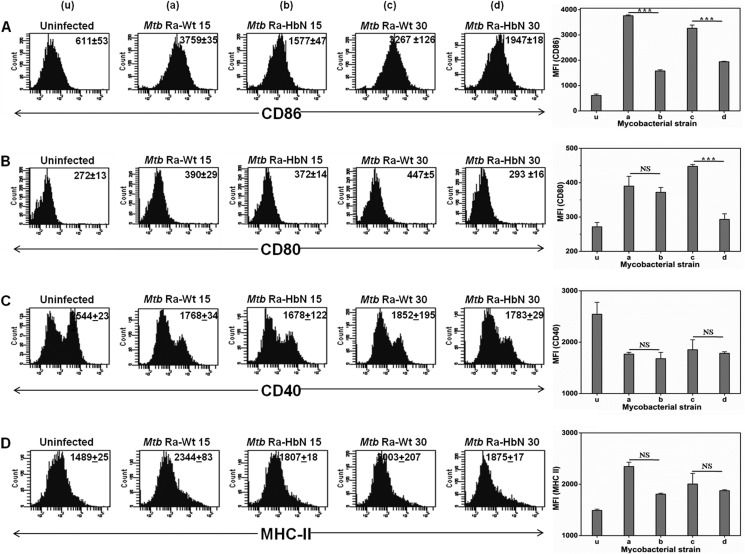
FIGURE 8.
Macrophage infection with MtbRa overexpressing HbN suppresses the exhibition of co-stimulatory surface markers. The mouse peritoneal macrophages were infected with 15- and 30-day-old cells of wild type and HbN-overexpressing cells of MtbRa at an MOI of 1:20 and incubated for 48 h. Bar diagrams and flow cytometry histograms indicate the expression of CD86 (A), CD80 (B), CD40 (C), and MHC-II (D). The x axis in the bar diagram represents the strains used for the infection, and the y axis indicates mean fluorescent intensity (MFI). Data represent mean ± S.E. (error bars) of two independent experiments. Numbers in the inset of flow cytometry histograms correspond to mean fluorescent intensity ± S.E. Statistical analysis was done by a one-way analysis of variance, Tukey-Kramer multiple comparison test. u, a, b, c, and d represent uninfected, Mtb Ra-Wt 15, Mtb Ra-HbN 15, Mtb Ra-Wt 30, and Mtb Ra-HbN 30, respectively.

