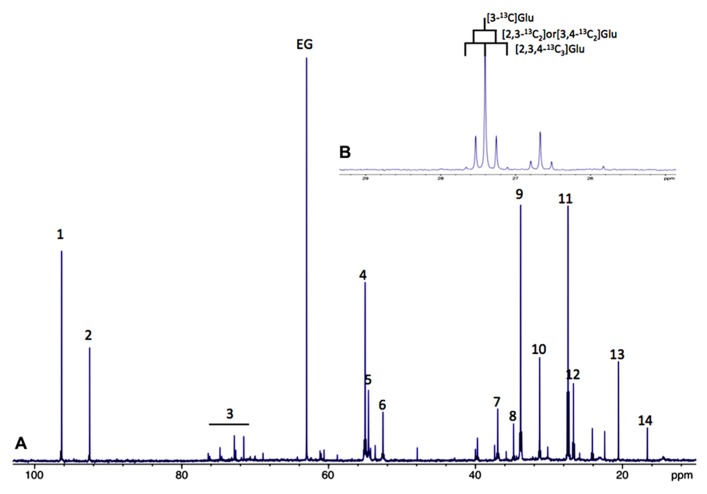
FIGURE 1.
(A) Typical 13C-NMR spectrum of rat brain perchloric extract, after perfusion with [1-13C]glucose. (1) Glucose C1α, (2) glucose C1β, 3: glucose C2, C3, C4, C5 and C6, 4: Glu C2, 5:Gln C2, 6: Asp C2, 7: Asp C3, 8: GABA C2, 9: Glu C4, 10: Gln C4, 11: Glu C3, 12: Gln C3, 13: lactate C3 and 14: Ala C3. (B) 13C-13C coupling figures allow to distinguish between different isotopomers (example on glutamate C3).

