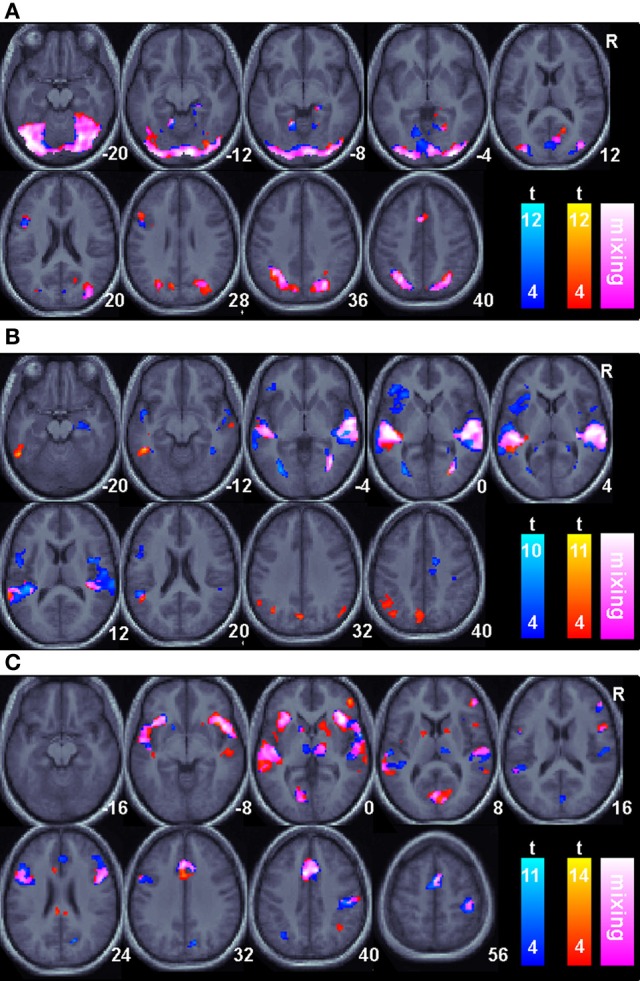
Figure 2.

Task related BOLD increases for correct trials relative to an arbitrary resting baseline for all sessions. Only areas surviving a p < 0.05(corrected) cluster level threshold are shown on the mean normalized anatomical image from all twelve subjects. The Non-linguistic session (N) is shown in a blue-cyan scale and the Informed, linguistic session (L) is shown in red-yellow scale. Overlapping areas are indicated by color mixing according to the color scale as shown in the legend. (A). The Visual cue portion of the task. (B). The Delay period portion of the task. (C). The Auditory target portion of the task.
