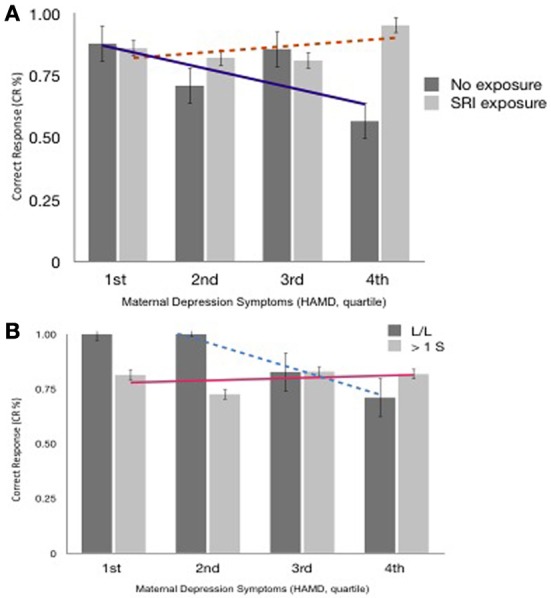
Figure 3.

(A) Accuracy (% Correct Response, Block 3 ± SEM), SRI exposure & Maternal Depressed Mood at 6 years postpartum (quartile). Trend lines reflect differences in CR% across maternal mood between exposure groups. (B) Accuracy (CR%, Correct Response, Block 3 ± SEM), SLC6A4 Allelic variations & Maternal Depressed Mood at 6 years postpartum (quartile). Trend lines reflect differences in CR% across maternal mood between allele groups.
