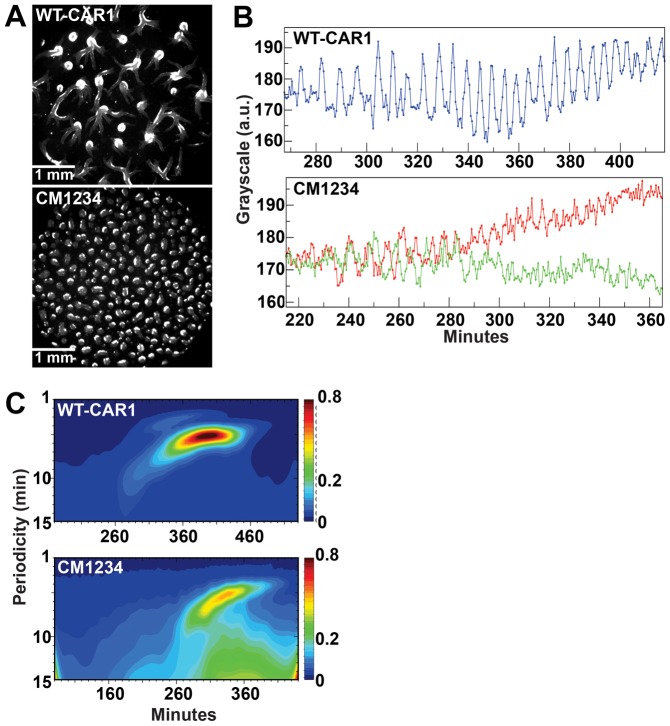
Fig. 2.
Loss of CAR1 phosphorylation impairs long-range cAMP signal relay. (A) WT-CAR1 and CM1234 cells were starved on non-nutrient agar surfaces and oscillatory cell shape changes imaged by dark-field microscopy and digitally recorded. Each frame is subtracted pixel by pixel from the subsequent frame to create a frame-subtracted image sequence for higher contrast. The single dark-field images shown are the mound phenotypes for the WT-CAR1 and CM1234 cells. Outwardly moving cAMP gradients are generated periodically from regularly spaced signaling centers that arise during development and are visualized under low magnification as optical density waves of alternating bands of bright migrating cells and dark bands of randomly oriented, quiescent cells (Alcantara and Monk, 1974; Tomchik and Devreotes, 1981; Sawai et al., 2007). See supplementary material Movies 8 and 9 for an example of a dark-field and frame-subtracted sequence for both WT-CAR1 and CM1234 cells. (B) Time-plots were obtained by measuring intensity changes (a.u. = arbitrary units) in an arbitrary region through the frame-subtracted image sequence. WT-CAR1 cells produce robust oscillations with a ∼5 minute period that are representative of all measurements in an aggregation field. Two measurements for CM1234 cells are shown to demonstrate their long-range signal disorganization. (C) Shown are wavelet contour plots of cellular oscillations through the frame-subtracted image sequences. The periodicity (minutes, y-axis) of synchronized oscillations over the time course (minutes, x-axis) yields the peak wavelet amplitude W(s;t) (for color scale, see Sawai et al., 2005).

