Fig. 7.

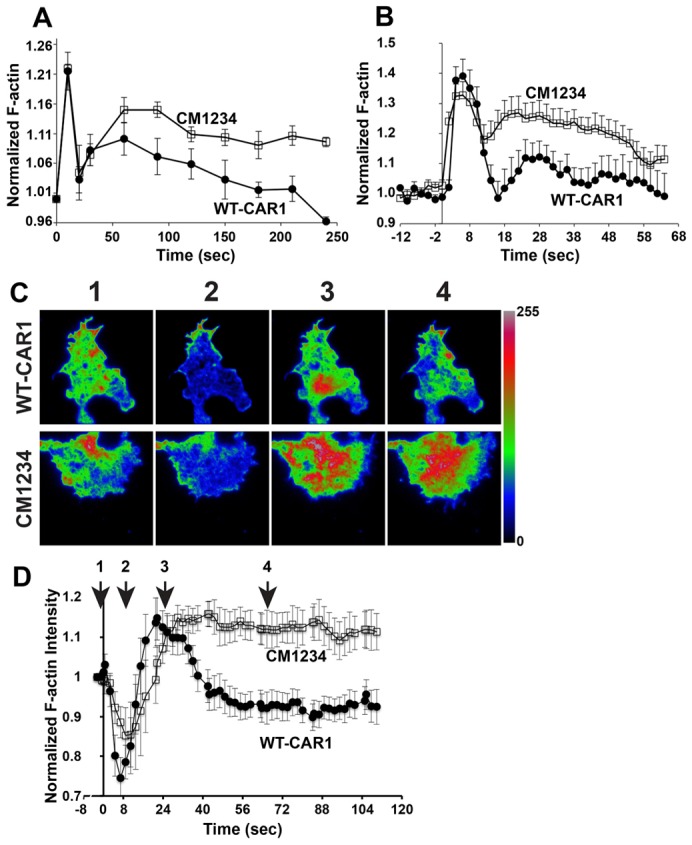
Secondary F-actin responses to global cAMP attenuate in WT-CAR1 cells, but not in CM1234 cells. (A) Differentiated WT-CAR1 (n = 4 experiments) and CM1234 (n = 5 experiments) cells received a global dose of 1 µM cAMP. MFI was measured by fluorometry and normalized to basal F-actin activity (0 seconds) in total cells fixed and stained with TRITC-phalloidin. ANOVA analysis indicates a significant difference between curves (P = 0.03 by ANOVA). (B) Differentiated WT-CAR1 and CM1234 cells expressing the ABD–GFP F-actin probe received a global dose of 1 µM cAMP (0 seconds). Optical sections of cells were imaged at 2 second intervals using a 100× objective lens by spinning-disk confocal microscopy. The Normalized F-actin response (see the Materials and Methods) and s.e.m. for WT-CAR1 (n = 18) and CM1234 cells (n = 20) from two separate experiments are plotted against time. ANOVA analysis indicates a significant difference between curves (P = 0.01 by ANOVA). (C) Differentiated WT-CAR1 and CM1234 cells expressing the ABD–GFP F-actin probe received a global dose of 1 µM cAMP mixed with the Alexa Fluor 633 dye (not shown), to track the application of the stimulus. Cells were imaged by TIR-FM at 2 second intervals using a 150× objective lens to capture F-actin polymerization dynamics proximal to the coverslip. Four representative events within the image sequence are delineated (see supplementary material Movies 15 and 16 to best view dynamics in gray scale): (1) Prestimulus condition; (2) Transient primary response showing loss of MFI in the contact area; (3) Secondary F-actin peak in the cell contact area; (4) Return to basal fluorescence intensity in WT-CAR1 cells and the continuation of F-actin activity in CM1234 cells. A rainbow LUT is used to highlight differences in fluorescence intensity on an eight-bit scale (scale shown). (D) Normalized average intensity change and s.e.m. in the entire contact area for WT-CAR1 (n = 11) and CM1234 cells (n = 10) from two separate experiments. The numbers above the graph approximately match the still images shown in Fig. 7C. ANOVA analysis indicates a significant difference between curves (P<0.0001 by ANOVA).
