Fig. 1.
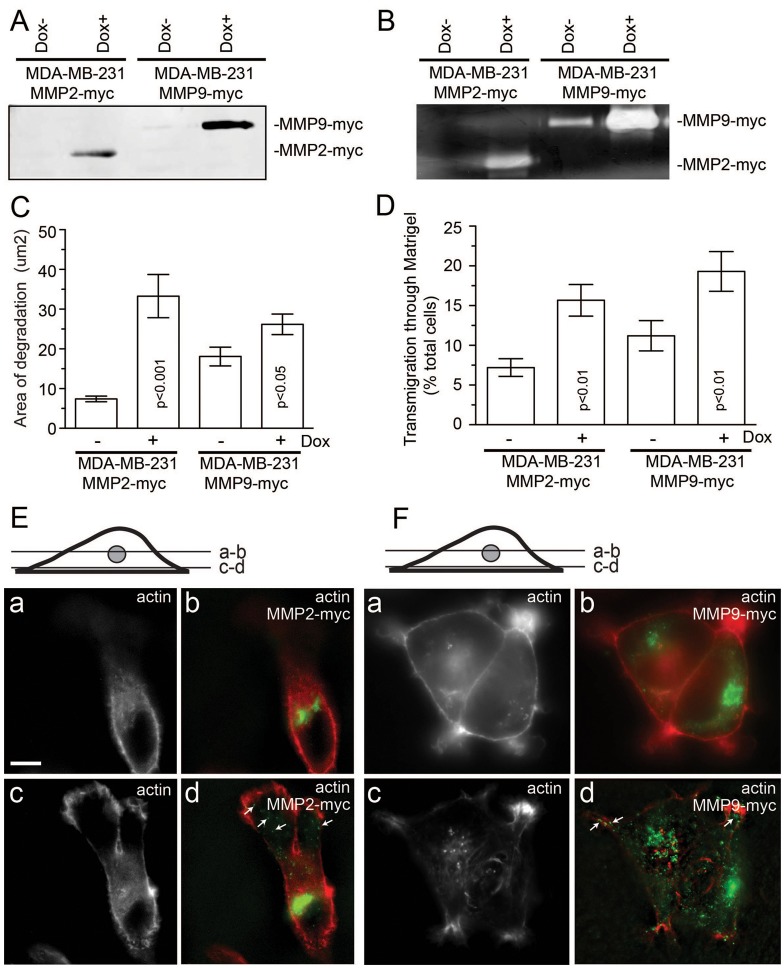
Characterization of MDA-MB-231 cell lines expressing tet-inducible MMP2–Myc or MMP9–Myc. (A,B) MDA-MB-231 cells expressing dox-inducible MMP2–Myc or MMP9–Myc were incubated in Opti-MEM for 24 hours in the absence or presence of 1 µg/ml doxycycline. Opti-MEM medium was then collected and the amount of secreted MMP2–Myc or MMP9–Myc was analyzed by immunoblotting (A) or zymography (B). (C) MDA-MB-231 cells expressing dox-inducible either MMP2–Myc or MMP9–Myc were plated on gelatin and fibronectin-HiLyte Fluor488-coated coverslips and incubated in the presence or absence of 1 µg/ml doxycycline. After incubation for 20 hours, cells were fixed and invadopodia-associated ECM degradation was analyzed by in situ zymography (for more details see the Materials and Methods). Data shown are the means and s.e. of three independent experiments. (D) MDA-MB-231 cells expressing dox-inducible MMP2–Myc or MMP9–Myc were plated on matrigel-coated 8-µm-pore filters and incubated in the presence or absence of 1 µg/ml doxycycline. The ability of cells to invade through Matrigel matrix was analyzed using Crystal Violet staining. The data shown are the means and s.d. from three independent experiments. (E,F) MDA-MB-231 cells expressing MMP2–Myc (E) or MMP9–Myc (F) were fixed and stained with Rhodamine-phalloidin and mouse anti-Myc antibodies. Panels a and b show optical sections at the TGN level, whereas panels c and d show optical sections at the coverslip level. Arrows indicate cytosolic organelles containing MMP2–Myc or MMP9–Myc. Scale bar: 5 µm.

