Fig. 2.
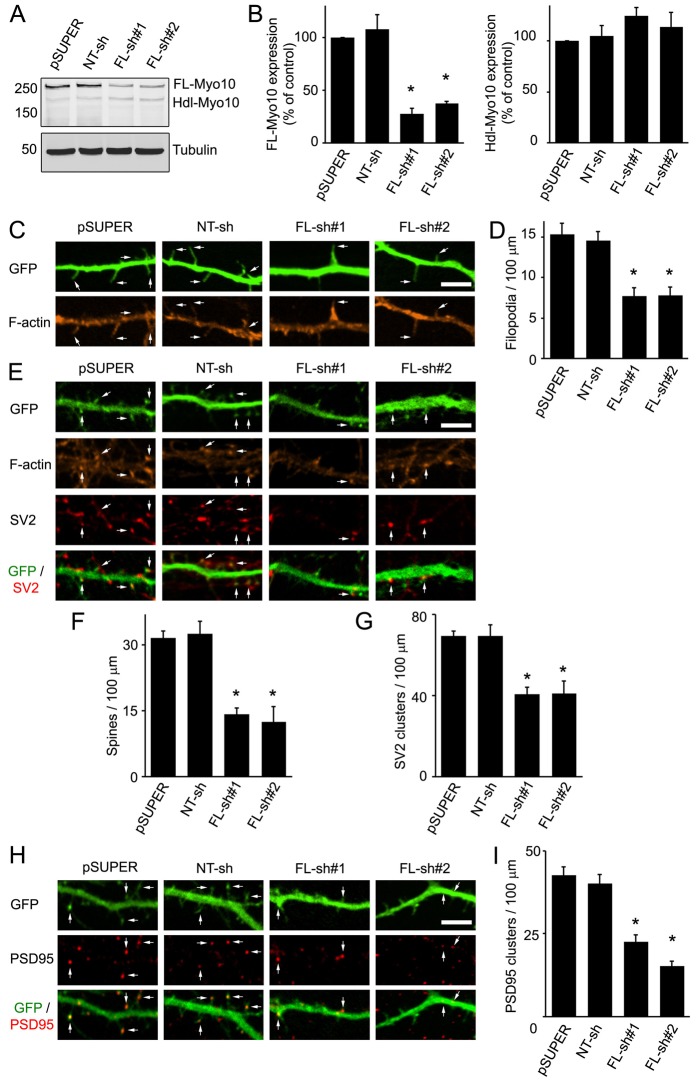
Knockdown of FL-Myo10 impedes the formation of dendritic filopodia and subsequently spines and synapses. (A) Rat astrocytes (DIV14–DIV17) were transfected with empty pSUPER vector, a non-targeting shRNA (NT-sh) or FL-Myo10 shRNAs (FL-sh#1, FL-sh#2). Three to five days after transfection, cell lysates were immunoblotted for Myo10 (top panel) and α-tubulin (bottom panel) as a loading control. (B) Quantification of endogenous levels of FL-Myo10 (left panel) and Hdl-Myo10 (right panel) from at least three separate experiments is shown. Error bars represent the s.e.m. (*P<0.0001). (C) Neurons (DIV3–DIV4) were co-transfected with GFP and empty pSUPER vector, NT shRNA or FL-Myo10 shRNAs, fixed and stained for F-actin using Alexa Fluor 546 phalloidin at DIV6–DIV7. Dendritic filopodia, which are thin protrusions without F-actin enrichment to their tips (arrows), are significantly reduced in neurons transfected with FL-Myo10 shRNA. Scale bar: 5 µm. (D) Quantification of the dendritic filopodia density in neurons transfected with the indicated constructs is shown. Error bars represent the s.e.m. for 40–50 dendrites from three separate experiments (*P<0.0001). (E,H) Neurons (DIV3–DIV4) were co-transfected with GFP and empty pSUPER vector, NT shRNA or FL-Myo10 shRNAs, fixed and stained for F-actin and synaptic markers (SV2, PSD95) at DIV11–DIV12. Spines, which exhibit a bulbous, F-actin-enriched head structure and contact SV2 or contain PSD95 clusters, are indicated (arrows). Scale bar: 5 µm. (F,G,I) Quantifications of dendritic spine and synaptic density (SV2 and PSD95 clusters) from neurons transfected with the indicated constructs are shown. Error bars represent the s.e.m. for 40–50 dendrites from at least three separate experiments (*P<0.0001). For panels B,D,F,G,I, asterisks indicate a statistically significant difference compared with pSUPER-transfected cells.

