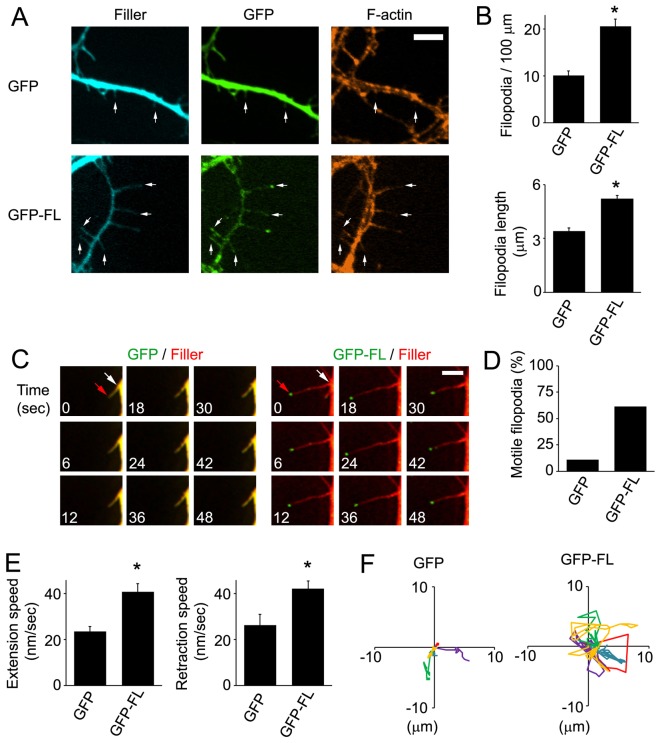
Fig. 3.
GFP–FL-Myo10 expression increases the density, length and dynamics of dendritic filopodia. (A) Neurons were co-transfected with either GFP–FL-Myo10 (GFP-FL) or GFP and a fluorescent filler, mCerulean, at DIV5, fixed and stained for F-actin at DIV6–DIV7. Dendritic filopodia are indicated (arrows). Scale bar: 5 µm. (B) Quantifications of the density (top panel) and the length (bottom panel) of dendritic filopodia from neurons transfected with the indicated constructs are shown. Error bars represent the s.e.m. for 40–50 dendrites (top panel) or 100 filopodia (bottom panel) from at least three separate experiments (*P<0.0001). (C–F) Neurons at DIV5 were co-transfected with either GFP–FL-Myo10 or GFP and a fluorescent filler, mCerulean or mCherry, and used for live-cell imaging the next day (DIV6). (C) Images were collected every 3 seconds using a Quorum spinning disk confocal microscope. The montage of images shows the extension and retraction of dendritic filopodia over time. In the first image, the tips (red arrows) and bases (white arrows) of dendritic filopodia are indicated. mCerulean fluorescent filler is false-colored red. Scale bar: 5 µm. (D) The percentage of motile filopodia was quantified from GFP–FL-Myo10- and GFP-expressing neurons. A total of 68–89 protrusions from at least three separate experiments were analyzed. (E) Quantification of speed of extension and retraction during the recording time is shown. Images were collected every 10 seconds for 10 minutes. Error bars represent the s.e.m. for 68–89 protrusions from three separate experiments (*P<0.0001). (F) Rose plots tracking the movement of five dendritic filopodia, in different colors, from neurons expressing GFP–FL-Myo10 and GFP are shown. GFP–FL-Myo10 expression results in vigorous lateral movement of dendritic filopodia.

