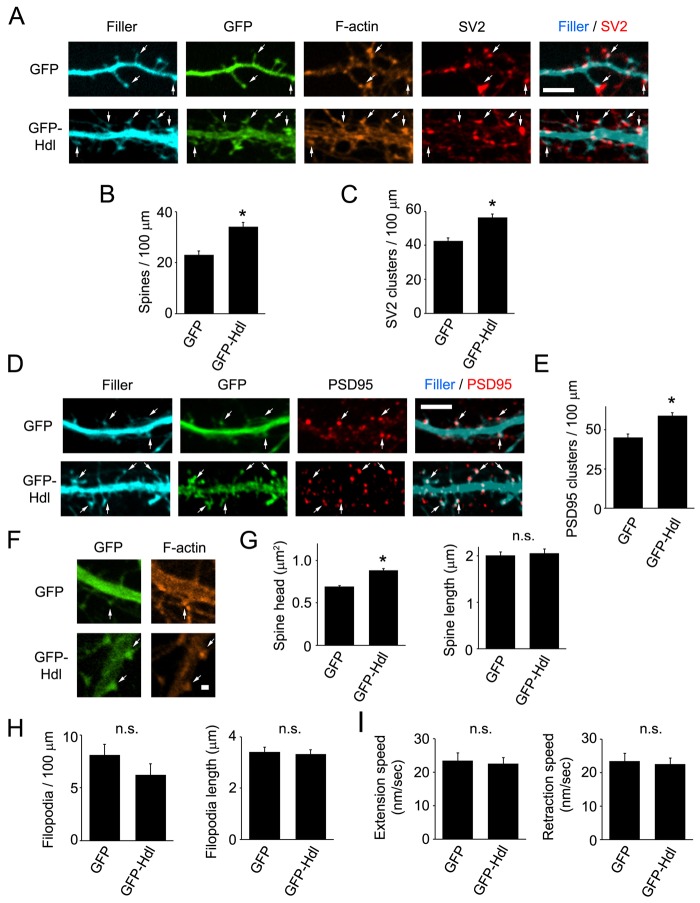
Fig. 5.
Expression of GFP–Hdl-Myo10 enhances dendritic spine and synaptic density and increases spine head size. (A–E) Neurons (DIV5–DIV6) were co-transfected with either GFP–Hdl-Myo10 (GFP-Hdl) or GFP and a fluorescent filler, mCerulean, fixed and stained for F-actin and synaptic markers (SV2, PSD95) at DIV11–DIV12. (A,D) Spine heads have an enrichment of F-actin and colocalize with synaptic proteins (arrows). Scale bar: 5 µm. (B,C,E) Quantifications of the dendritic spine and synaptic density (SV2 and PSD95 clusters) from neurons transfected with GFP–Hdl-Myo10 or GFP are shown. Error bars represent the s.e.m. for 43–45 dendrites from three separate experiments (*P<0.0001). (F) Neurons (DIV5–DIV6) were transfected with GFP–Hdl-Myo10 or GFP, fixed and stained for F-actin at DIV11–DIV12. Scale bar: 1 µm. (G) Quantifications of spine head size and spine length for neurons expressing GFP–Hdl-Myo10 or GFP are shown. Error bars represent the s.e.m. for 200 spines from three separate experiments (*P<0.0001). (H) Neurons at DIV6–DIV7 were co-transfected with a fluorescent filler, mCerulean, and either GFP or GFP–Hdl-Myo10, and dendritic filopodia were analyzed at DIV7–DIV8. Quantifications of the density (left panel) and length (right panel) of dendritic filopodia from neurons expressing GFP or GFP–Hdl-Myo10 (GFP-Hdl) are shown. Error bars represent the s.e.m. for 33–39 dendrites (left panel) and 102–104 dendritic filopodia from three separate experiments. (I) Neurons at DIV5 were co-transfected with a fluorescent filler, mCherry, and either GFP or GFP–Hdl-Myo10 and subjected to live-cell imaging the next day (DIV6). Images were collected every 10 seconds for 10 minutes. Quantifications of the speed of extension and retraction of dendritic filopodia from neurons expressing GFP or GFP–Hdl-Myo10 are shown. A total of 63–89 protrusions from at least three separate experiments were analyzed. Error bars represent the s.e.m. for 63–89 protrusions from three separate experiments. For panels G–I, n.s. denotes the absence of a statistically significant difference.

