Fig. 7.
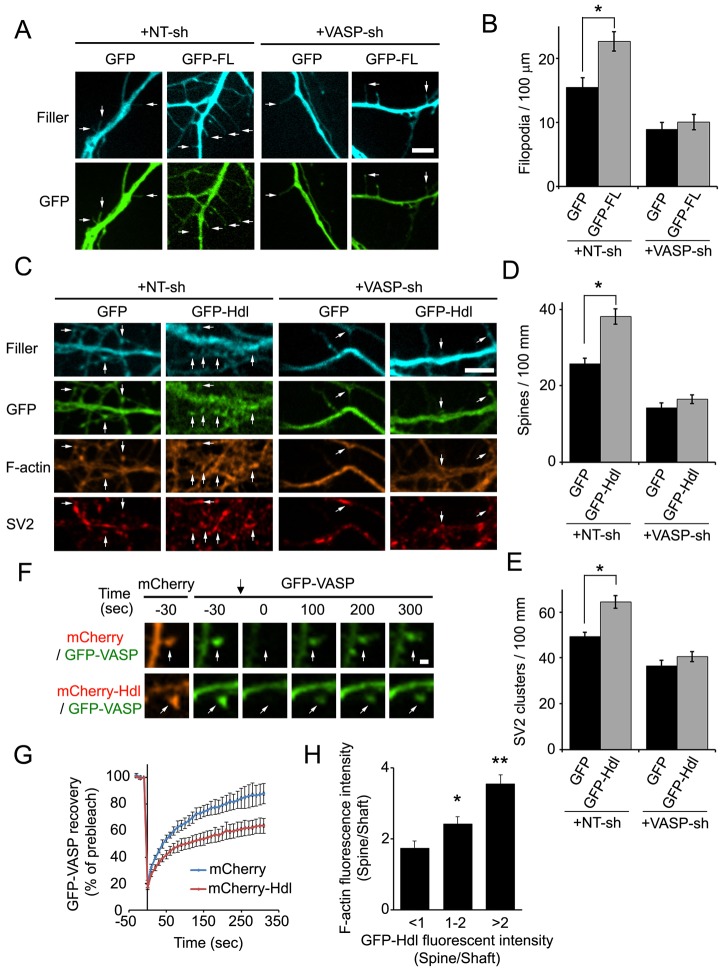
FL-Myo10 and Hdl-Myo10 regulate dendritic spine and synapse development through VASP. (A) Neurons were co-transfected with a fluorescent filler, mCerulean, and either GFP or GFP–FL-Myo10 (GFP-FL) and NT shRNA (NT-sh) or VASP shRNA (VASP-sh) at DIV3–DIV4 and fixed at DIV6–DIV7. Dendritic filopodia are indicated (arrows). Scale bar: 5 µm. (B) Quantifications of the density of dendritic filopodia from neurons transfected with the indicated constructs are shown. Error bars represent the s.e.m. for 44–47 dendrites from three separate experiments (*P<0.002). (C) Neurons were co-transfected with vectors fluorescent filler, mCerulean, and either GFP or GFP–Hdl-Myo10 (GFP-Hdl) and either NT shRNA or VASP shRNA at DIV3–DIV4, fixed and stained for F-actin and SV2 at DIV11–DIV12. Dendritic spines are indicated (arrows). Scale bar: 5 µm. (D,E) Quantifications of dendritic spine and synaptic density (SV2 clusters) from neurons transfected with the indicated constructs are shown. Error bars represent the s.e.m. for 44–47 dendrites from three separate experiments (*P<0.0001). (F) Neurons were co-transfected with GFP–VASP and either mCherry–Hdl-Myo10 (mCherry-Hdl) or mCherry at DIV6, and the indicated spines (white arrows) were subjected to FRAP at DIV11. Prebleached and subsequent recovery images are shown. The photobleach point is indicated (black arrow at t = 0). Scale bar: 1 µm. (G) Quantifications of the recovery of GFP–VASP after photobleaching in neurons expressing mCherry or mCherry–Hdl-Myo10 are shown. Error bars represent the s.e.m. from three separate experiments for 40–42 spines. (H) Neurons (DIV5–DIV6) were co-transfected with GFP–Hdl-Myo10 and a fluorescent filler, mCerulean, fixed and stained for F-actin at DIV11–DIV12. The fluorescence intensities of GFP–Hdl-Myo10 (GFP–Hdl) and F-actin were quantified in dendritic spine heads and normalized to neighboring shafts. A total of 81 spines from three separate experiments were analyzed and categorized based on their amount of GFP–Hdl-Myo10. Error bars represent the s.e.m. for 15–35 spines from three separate experiments (*P<0.02, **P<0.0001). Asterisks indicate a statistically significant difference compared with the first category (GFP–Hdl <1).

