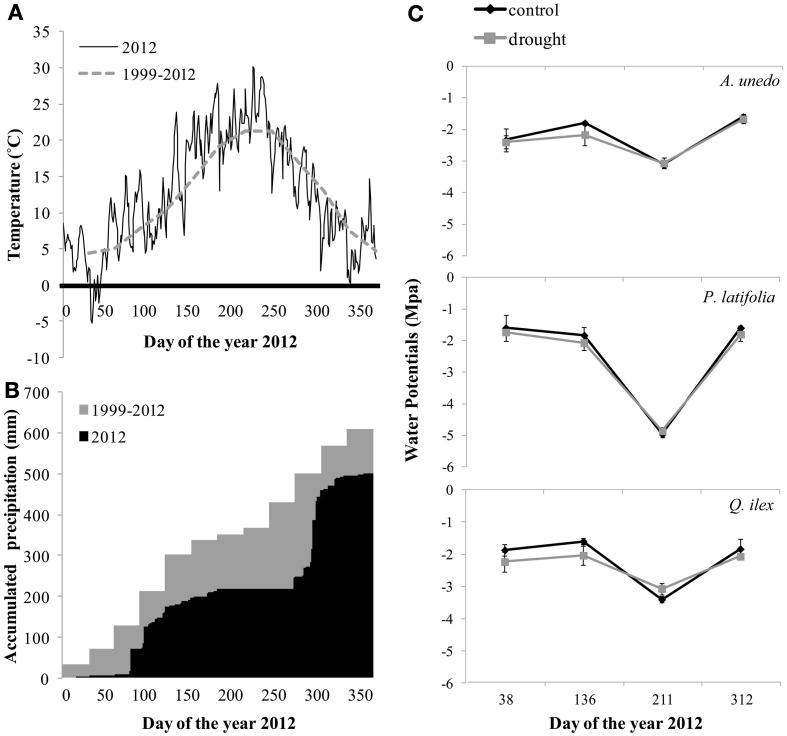
Figure 1.
Environmental variables during the period of study. (A) Daily temperature in 2012 and monthly average temperature during the years 1999–2012, (B) daily accumulated precipitation in 2012 and monthly accumulated precipitation during the years 1999–2012 and (C) seasonal patterns of midday leaf water potentials during 2012. Bars represent standard error (n = 3 plot averages).

