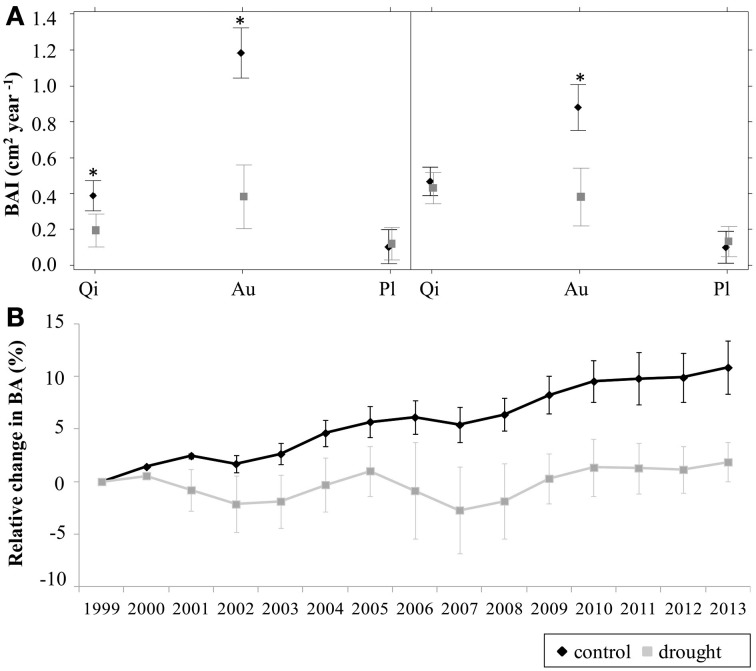
Figure 2.
(A) Mean annual basal area increment (BAI) during the periods 1999–2002 and 2003–2012 for living stems of Quercus ilex (Qi), Arbutus unedo (Au) and Phillyrea latifolia (Pl) individuals in control (black) and drought (gray) plots, according to the results of the general linear mixed model used to fit BAI data (see text for details). Each symbol represents the value of the corresponding model coefficient, and bars represent their standard errors (at the plot level). Asterisks indicate significant differences between treatments within a species (P < 0.05). (B) Relative change in basal area (BA) during the overall studied period (cumulative from 1999) for living stems of all species in control (black) and drought (gray) plots. Bars represent standard errors (n = 3 plots).

