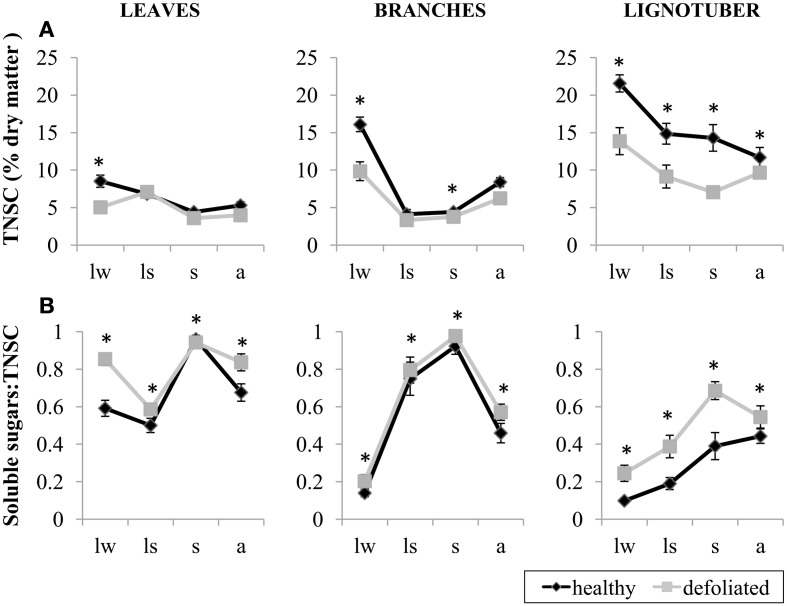
Figure 5.
(A) Percent dry matter concentrations of total non-structural carbohydrates (TNSC) and (B) the ratio between soluble sugars and total non-structural carbohydrates (TNSC) in leaves, branches and lignotuber of Quercus ilex individuals sampled outside the experimental plots, as a function of defoliation: healthy canopy with >50% green leaves (black) and defoliated canopy with <50% green leaves (gray). Samples were collected in late winter (lw), in late spring (ls), in summer (s) and in autumn (a) 2012. Asterisks indicate significant differences between healthy and defoliated individuals (P < 0.05). Bars represent standard errors (n = 10 individuals).

