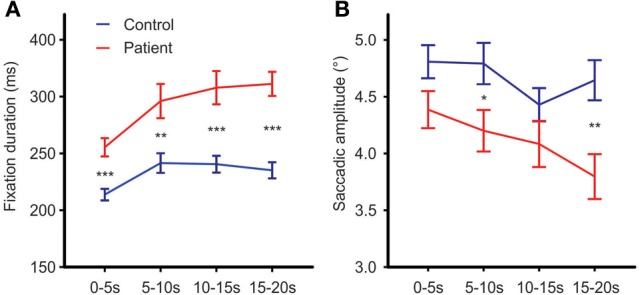
Figure 4.

Fixation durations (A) and mean saccadic amplitude (B) over the time course of free visual exploration of daily life scenes in patients with schizophrenia (N = 32) and healthy controls (N = 33). The exploration time of 20 s was divided into four intervals of 5 s each. Post-hoc t-tests confirmed significant group differences in all four time intervals [0–5 s: t(63) = −4.41,p < 0.001, d′ = −1.09; 5–10 s: t(63) = −3.17, p = 0.002, d′ = −0.79; 10–15 s: t(63) = −4.15, p = 0.001, d′ = −1.03; 15–20 s: t(63) = −5.99,p = 0.001, d′ = −1.49]. Indicated are means with standard errors, for post-hoc comparisons between groups: *p < 0.05, **p < 0.01, ***p < 0.001.
